

Wix Analytics: About Wix Analytics Reports
4 min
In this article
- Viewing your reports
- About the report categories
- Understanding partial reports
- Customizing your reports
- FAQs
Gain insights about your site and make smart business decisions with Wix Analytics reports. Choose how to view your reports and customize them to focus on the data that interests you most.
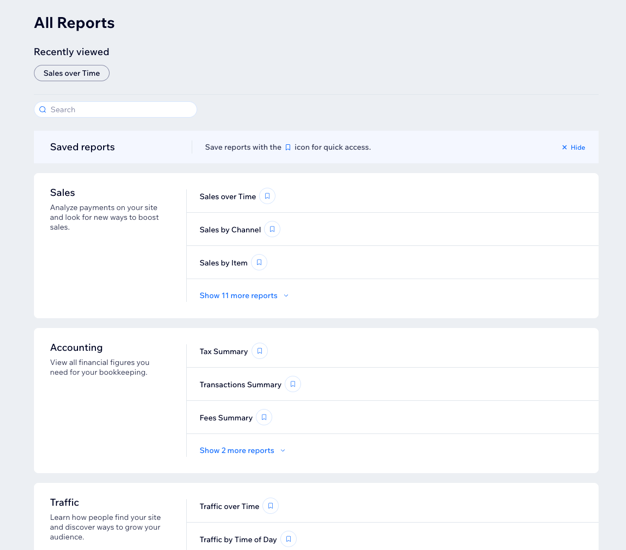
You can find the All Reports page under Analytics in your site's dashboard.
Viewing your reports
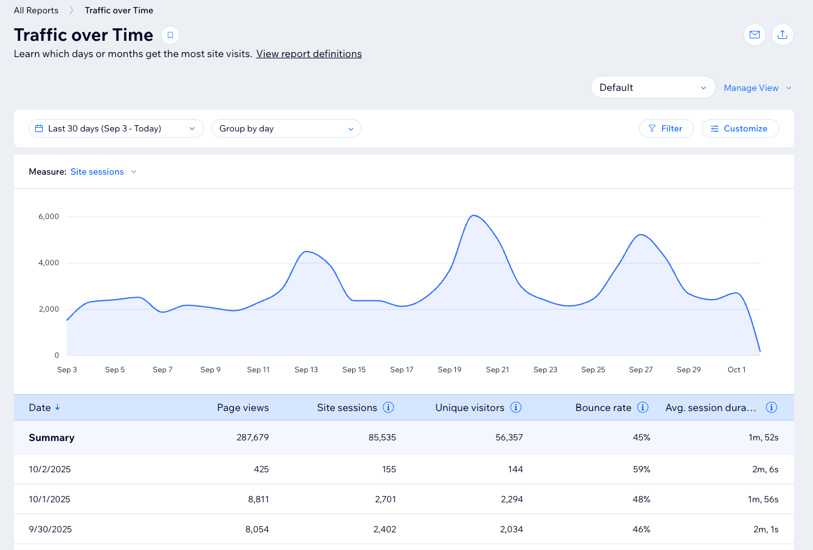
Wix Analytics reports include a broad range of editable pre-built reports to display your data. Each report displays your data in a table view, along with an additional visualization to help you see trends and insights at a glance:
- Table displays your data in rows and columns. Every report includes this view.
- Bar chart displays and compares your data.
- Line chart shows how your data has changed over time.
- Bar chart split displays multiple data series in one report.
- Heat map displays your data using intensity of color in grid format.
- Funnel displays your data in steps.
- Map displays geographical data.
- Pie chart displays your data in sections.
Tip:
Learn more about customizing report views.
About the report categories
Your reports are divided into categories to help you find information about how your business is performing, with new reports added all the time. Depending on the Wix products you use, your reports are split into the following categories:
Tip:
You can also gather data in specific reports about email marketing and form submissions.
Understanding partial reports
Wix provides you with tools to build GDPR compliant websites. If your sites have Wix's cookie banner enabled, Analytics does not report visitor data before visitors actively consent to analytics cookies to be placed on their device. In such cases, Traffic and Behavior reports will be partial.
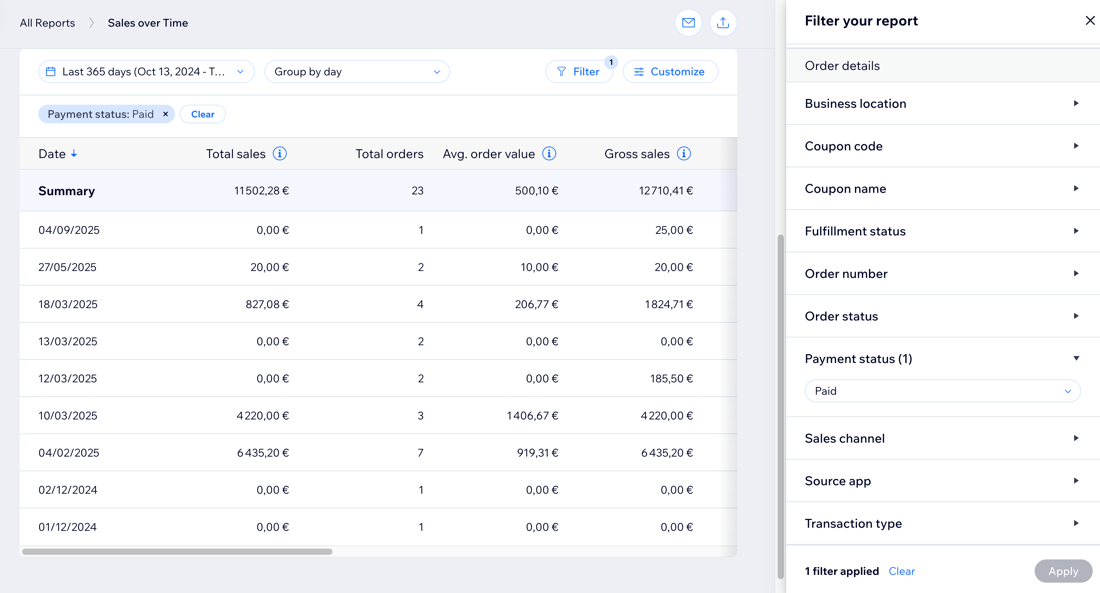
Customizing your reports
You can view your reports in different ways and customize them to present the data according to your preferences. Learn more about customizing reports.
FAQs
Click a question to learn more about Wix Analytics reports.
Can I check reports from my mobile device?
 at the bottom.
Can I get reports sent to my email?
How do I save my favorite reports so that I can access them quickly?
 next to a specific report to add it to your saved reports. Your saved reports appear at the top of the page.
Where can I learn about the terms used in these reports?