Wix Restaurants: Understanding Wix Analytics Reports
4 min
In this article
- Types of Wix Restaurants reports
- Types of Table Reservations reports
- FAQs
With Wix Analytics, you can monitor key insights from your Wix Restaurants site. Get a clear overview of your orders, reservations, visitor behavior, and overall performance, helping you understand trends and make informed decisions.
The reports you see in your dashboard depend on the apps you have installed:
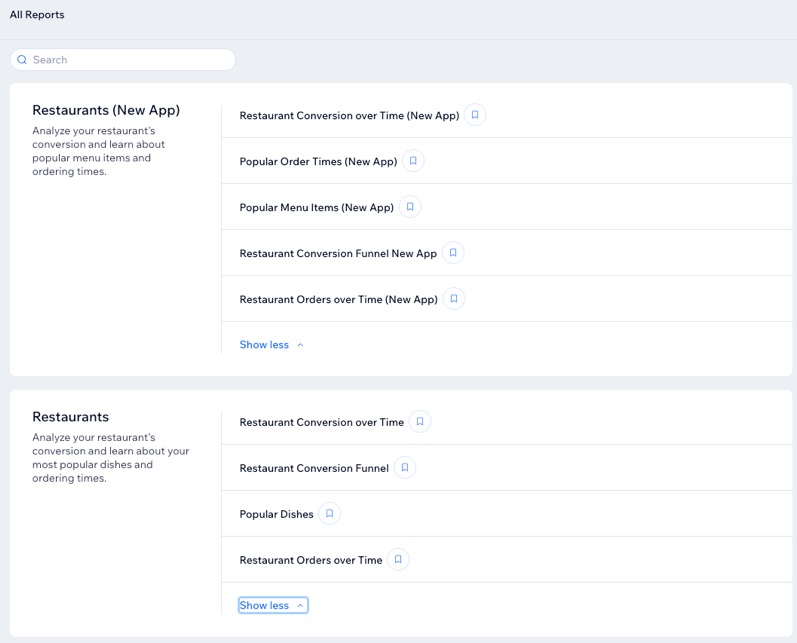
- Wix Restaurants Online Orders (Old): Reports appear under Restaurants.
- Wix Restaurants Online Orders (New): Reports appear under Restaurants (New App).
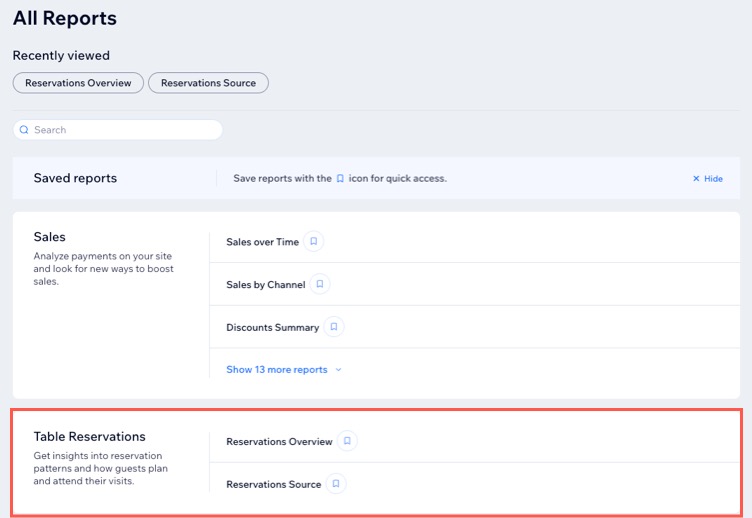
- Wix Table Reservations: Reports appear under Table Reservations.
How to access your Wix Restaurants and Table Reservations reports:
Go to All Reports in your site's dashboard and scroll down to the relevant section.
Types of Wix Restaurants reports
Understand the different types of Wix Restaurants reports available to help you analyze your restaurant's performance. Learn which reports help track visitor behavior, identify popular dishes, monitor order trends, and discover peak order times.
Click a report type below to learn more about it:
Popular Dishes / Popular Menu Items
Restaurant Orders over Time
Popular Order Times
Restaurant Conversion Funnel
Restaurant Conversion over Time

Types of Table Reservations reports
Get insights into how customers book and show up for their reservations and experiences.
Click a report type below to learn more about it:
Reservations Overview
Reservations Source

FAQs
Click a question below to learn more about your Wix Analytics Restaurants reports.
Why do I see different numbers on the Home page and in the Restaurant reports?
Where can I learn about the terms used in these reports?


