

Advanced Analytics Tools: Building a Custom Report
6 min
In this article
- Step 1 | Create a new report
- Step 2 | Add a tile to your report
- Step 3 | Choose an Explore
- Step 4 | Choose Measures and Dimensions
- Step 5 | Run your report
- Step 6 | Choose how to view your report
- Step 7 | Save your changes
- FAQs
Create a new Wix Analytics report to answer specific questions that weren’t addressed in existing pre-built reports. Learn how to create a new report, and how to use tools such as report tiles, analytics tables, Measures and Dimensions.
Important:
- Before creating a new report, check if a pre-built report matches your needs. You can also customize the report and save a new view to focus on the data that interests you most.
- To create a new report or duplicate and edit a report, you must upgrade your Wix site to the Business Elite plan (for Wix Editor users) or an Elite plan (for Studio users).
Step 1 | Create a new report
Get started by giving your new custom report a name and a description.
To create a new report:
- Go to All Reports in your site's dashboard.
- Click the More Actions icon at the top right and select Create a custom report.
- Click Get Started.
- Add your report name and description.
- Click Create Your Report
 at the top right and select Create a custom report.
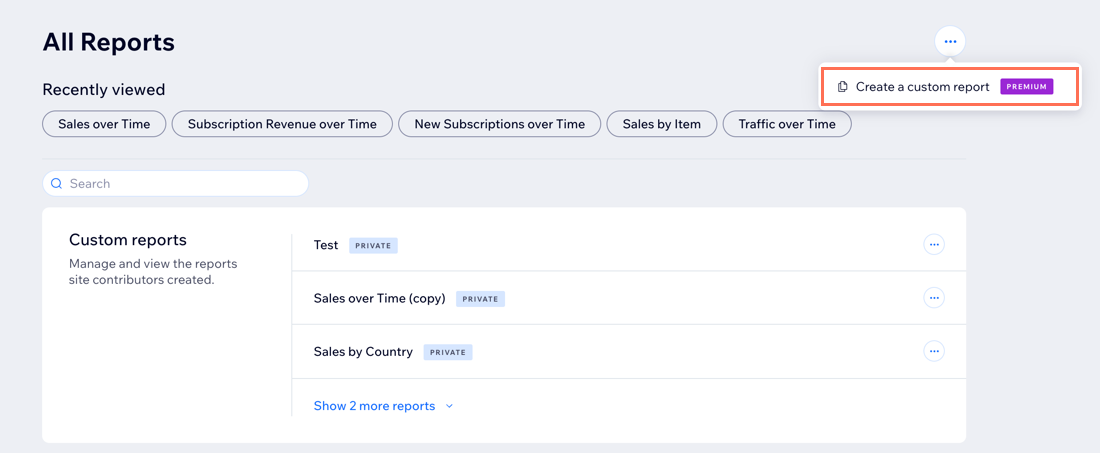
Step 2 | Add a tile to your report
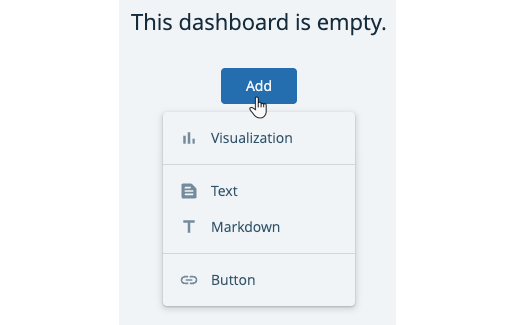
A tile is a visualization of your data. To create a tile you’ll need to choose a topic (Explore), the data you are interested in (Measures and Dimensions), and how you want to display your data (Visualization).
To add a tile to your report:
- Click Edit Dashboard.
- Click Add and select Visualization.
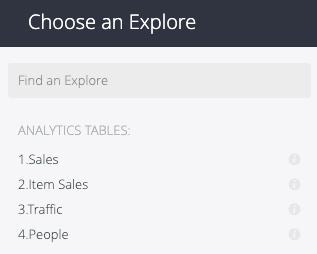
Step 3 | Choose an Explore
Choose an Explore from the list on the left. Each Explore focuses on different elements of your data. The Explore is considered the topic of your tile.
How to choose an Explore
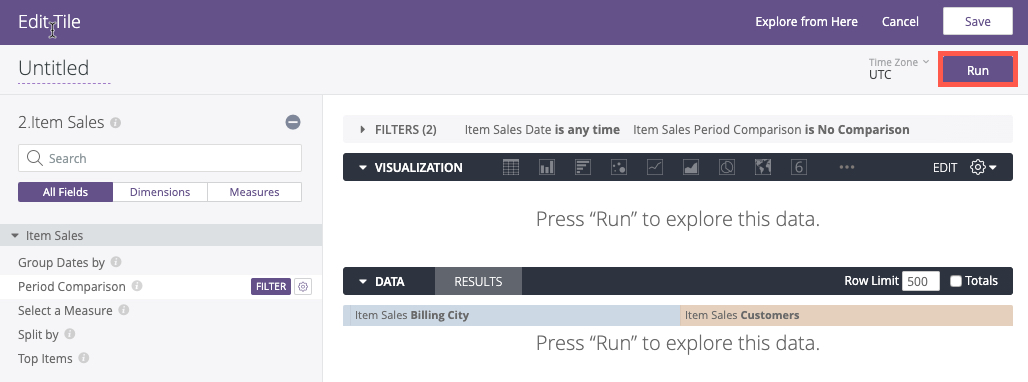
Step 4 | Choose Measures and Dimensions
Measures and Dimensions include all of the metrics you can include in your reports.
You can choose:
- Single measures. This is ideal to present a single value chart, such as total value, number of customers, or number of orders.
- Measure + Dimension. This is useful when you want to add a line chart with an x and y axis, bar chart, or pie chart.
- Multiple dimensions + multiple measures. This is useful when you want to add a table tile.
Once you've chosen your Measures and Dimensions, name your Tile in the Edit Tile window.
How to choose Measures and Dimensions


Step 5 | Run your report
To run your report, click Run at the top right. Your results will load in the data pane.
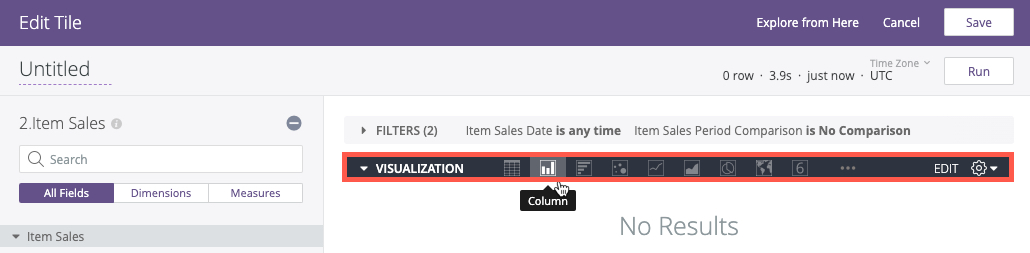
Step 6 | Choose how to view your report
You can choose to see your data in a table, bar chart, columns, scatterplot, line, area, pie chart, map, or single value.
Click your preferred visualization icon, and your data will be displayed accordingly.
Step 7 | Save your changes
- Click Save, and the tile will be added to your report.
- (Optional) To resize a tile after saving, click the lower right corner of the tile and drag to adjust.
- Click Save to create your report.
Tip: Once saved, your report will be available in your Custom reports list.


What's next?
FAQs
Click a question to learn more about custom reports.
Can I subscribe to a custom report?
Is it possible to combine different metrics from different data models in the same custom report?
After upgrading my site, how long does it take for custom reports to be available?