Advanced Analytics Tools: Duplicating and Editing a Report
6 min read
In this article
- Step 1 | Duplicate a report
- Step 2 | Edit the dashboard
- Step 3 | Edit an existing tile
- Step 4 | Run your report
- Step 5 | Choose how to view your report
- Step 6 | Save your updated tile
- Step 7 | (Optional) Add additional tiles
- Step 8 | Save your updated report
Duplicate and edit an existing Wix Analytics report to create tailored reports for your business needs.
Important:
- Before duplicating and editing a report, check if a pre-built report matches your needs. You can also customize the report and save a new view to focus on the data that interests you.
- To create a new report or duplicate and edit a report, you must upgrade your Wix site to the Business Elite plan (for Wix Editor users) or an Elite plan (for Studio users).
Step 1 | Duplicate a report
When a report is duplicated, only the current view (table, chart, map) is copied over into the new version. The duplicate report will not include other views. You can customize the duplicate report through the report builder interface.
To duplicate a report:
- Go to All Reports in your site's dashboard.
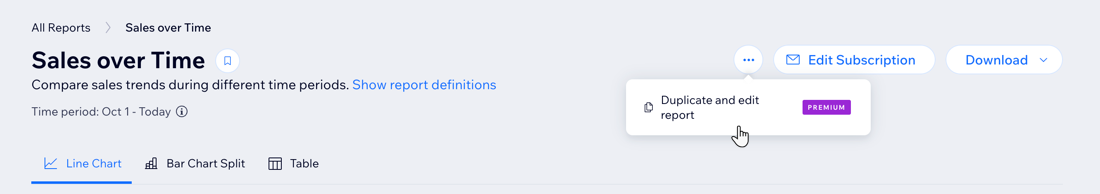
- Select the report you want to duplicate.
- Click the More Actions icon
 at the top right and select Duplicate and edit report.
- Click Start Now on the pop up window.
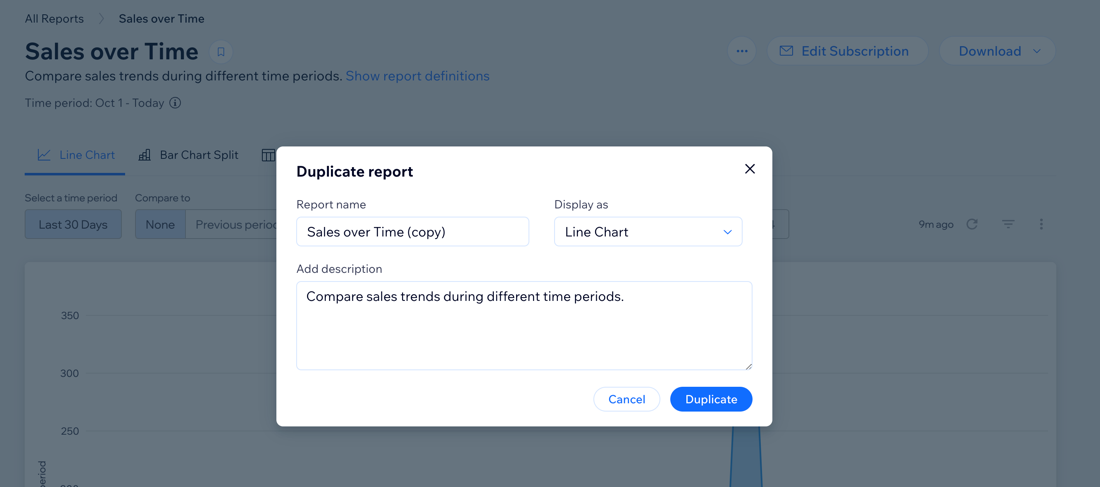
- Add your report title, select the display type (e.g. line chart, table), and a description which any collaborator you’re working with may find useful.
- Click Duplicate.
Tip:
After duplicating and saving a report, you'll be able to access it in your Custom Reports list on the All Reports page.
Step 2 | Edit the dashboard
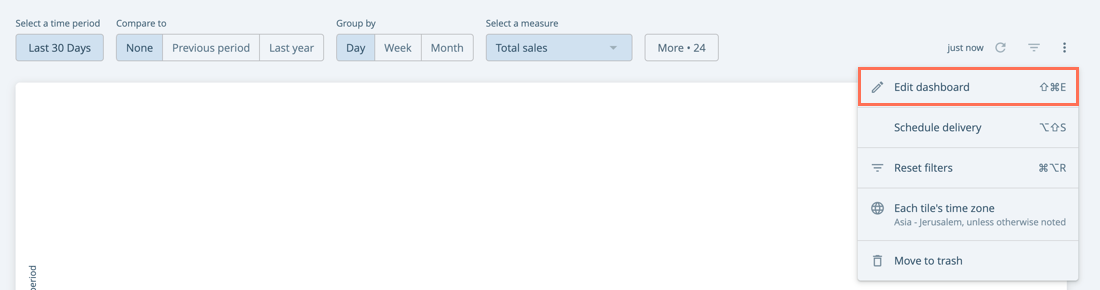
- Click the More Actions icon
 .
. - Select Edit dashboard from the drop-down menu.
Step 3 | Edit an existing tile
A tile is a visualization of your data which answers a specific question - For example, “Where are my customers located?”.
To edit an existing tile you’ll need to edit the data it holds (Measures and Dimensions). You can also edit the way your data is displayed by changing the visualization type.
Important:
When you edit an existing tile you should take into account that you cannot change the tile Explore. This means that your tile topic cannot be changed, and can only contain data of the same topic (Sales, Item Sales, Traffic, People, etc).
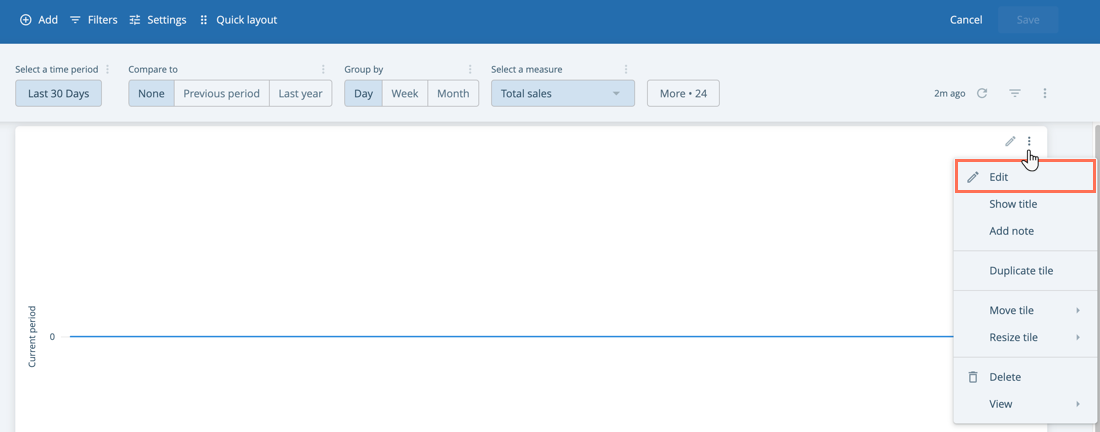
To edit an existing tile:
- Click the More Actions icon
 .
. - Click Edit.
- Change the Tile data by selecting and deselecting Dimensions and Measures.
How to choose Dimensions and Measures


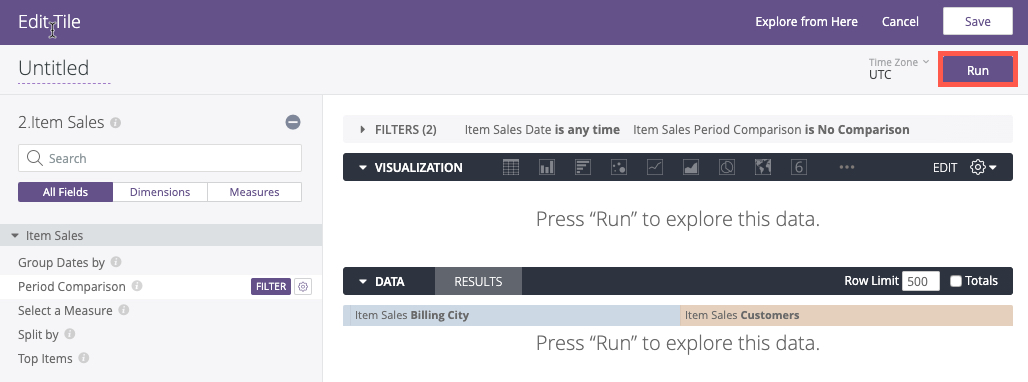
Step 4 | Run your report
To run your report, click Run at the top right. Your results will load in the data pane.
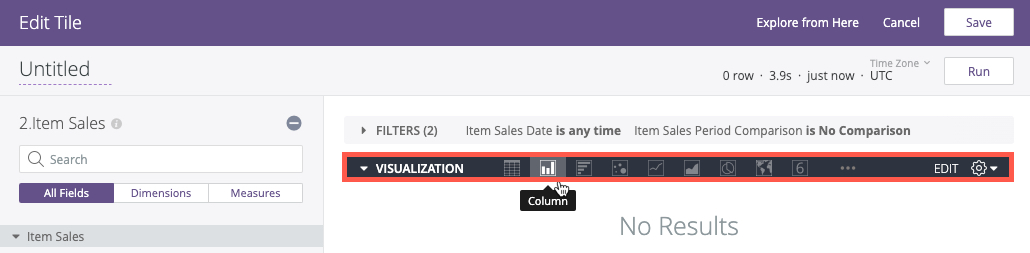
Step 5 | Choose how to view your report
You can choose to see your data in a table, bar chart, columns, scatterplot, line, area, pie chart, map, or single value.
Click your preferred visualization icon, and your data will be displayed accordingly.
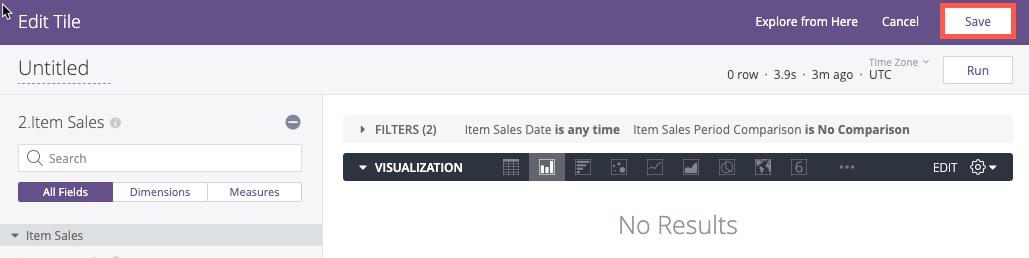
Step 6 | Save your updated tile
Click Save, and the tile will be updated.
Step 7 | (Optional) Add additional tiles
You can add additional tiles to enrich your reports. Your new tiles can have different subjects such as sales, items sales, traffic or people.
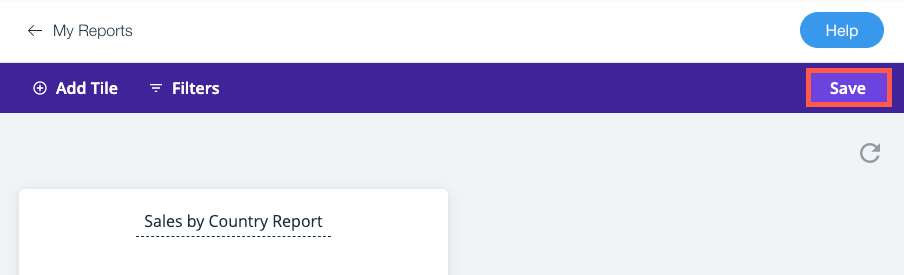
Step 8 | Save your updated report
Once you're done editing your report, click Save at the top right.