Wix Analytics: Working with Report Views in Analytics Reports
9 min read
In this article
- Customizing your view
- Comparing report periods
- FAQs
Customize our pre-built reports so they show the info you need, the way you prefer seeing it. A clear view of your data helps you gain meaningful insights about your business and make data-driven decisions as a result.
Note:
This article covers all report views (e.g. line charts, bar charts) except for the table view. Learn more about customizing the table view.
Tip:
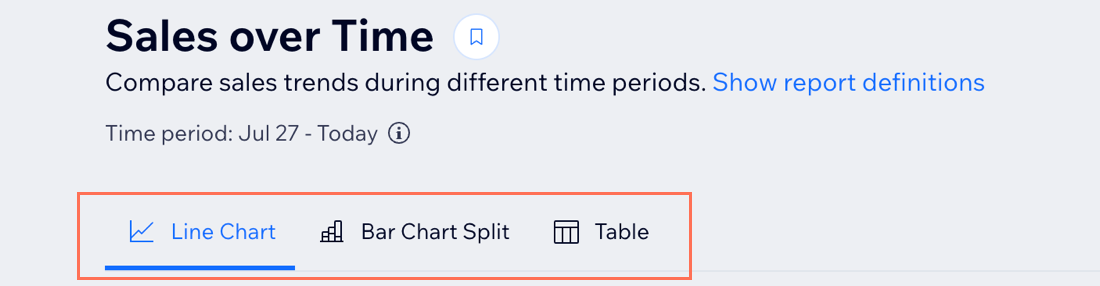
Switch between report views at the top to see the data displayed in different ways. Each view contains unique capabilities and customization options, with different metrics presented.
Customizing your view
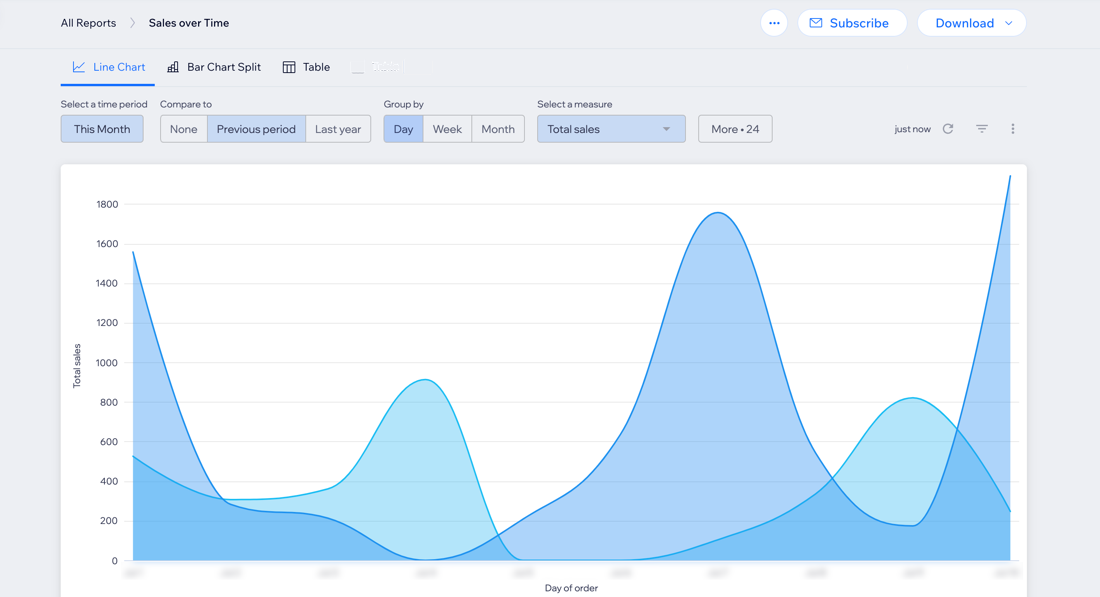
Customize your view in a report to focus on the data that matters most to you. You can change a report's time period, add filters, group data, and more, depending on what type of view you chose.
Note:
Some views limit the amount of data shown and how far back it goes. If you can't get to the data you need, switch to a different view.
To customize your view:
Dashboard
Wix app
Wix Studio app
- Go to All Reports in your site's dashboard.
- Select the relevant report.
- Choose what you want to do:
Change report dates

Add filters

Select a measure

Group data by time period

(Bar Chart Split view) Split report data between different metrics

Comparing report periods
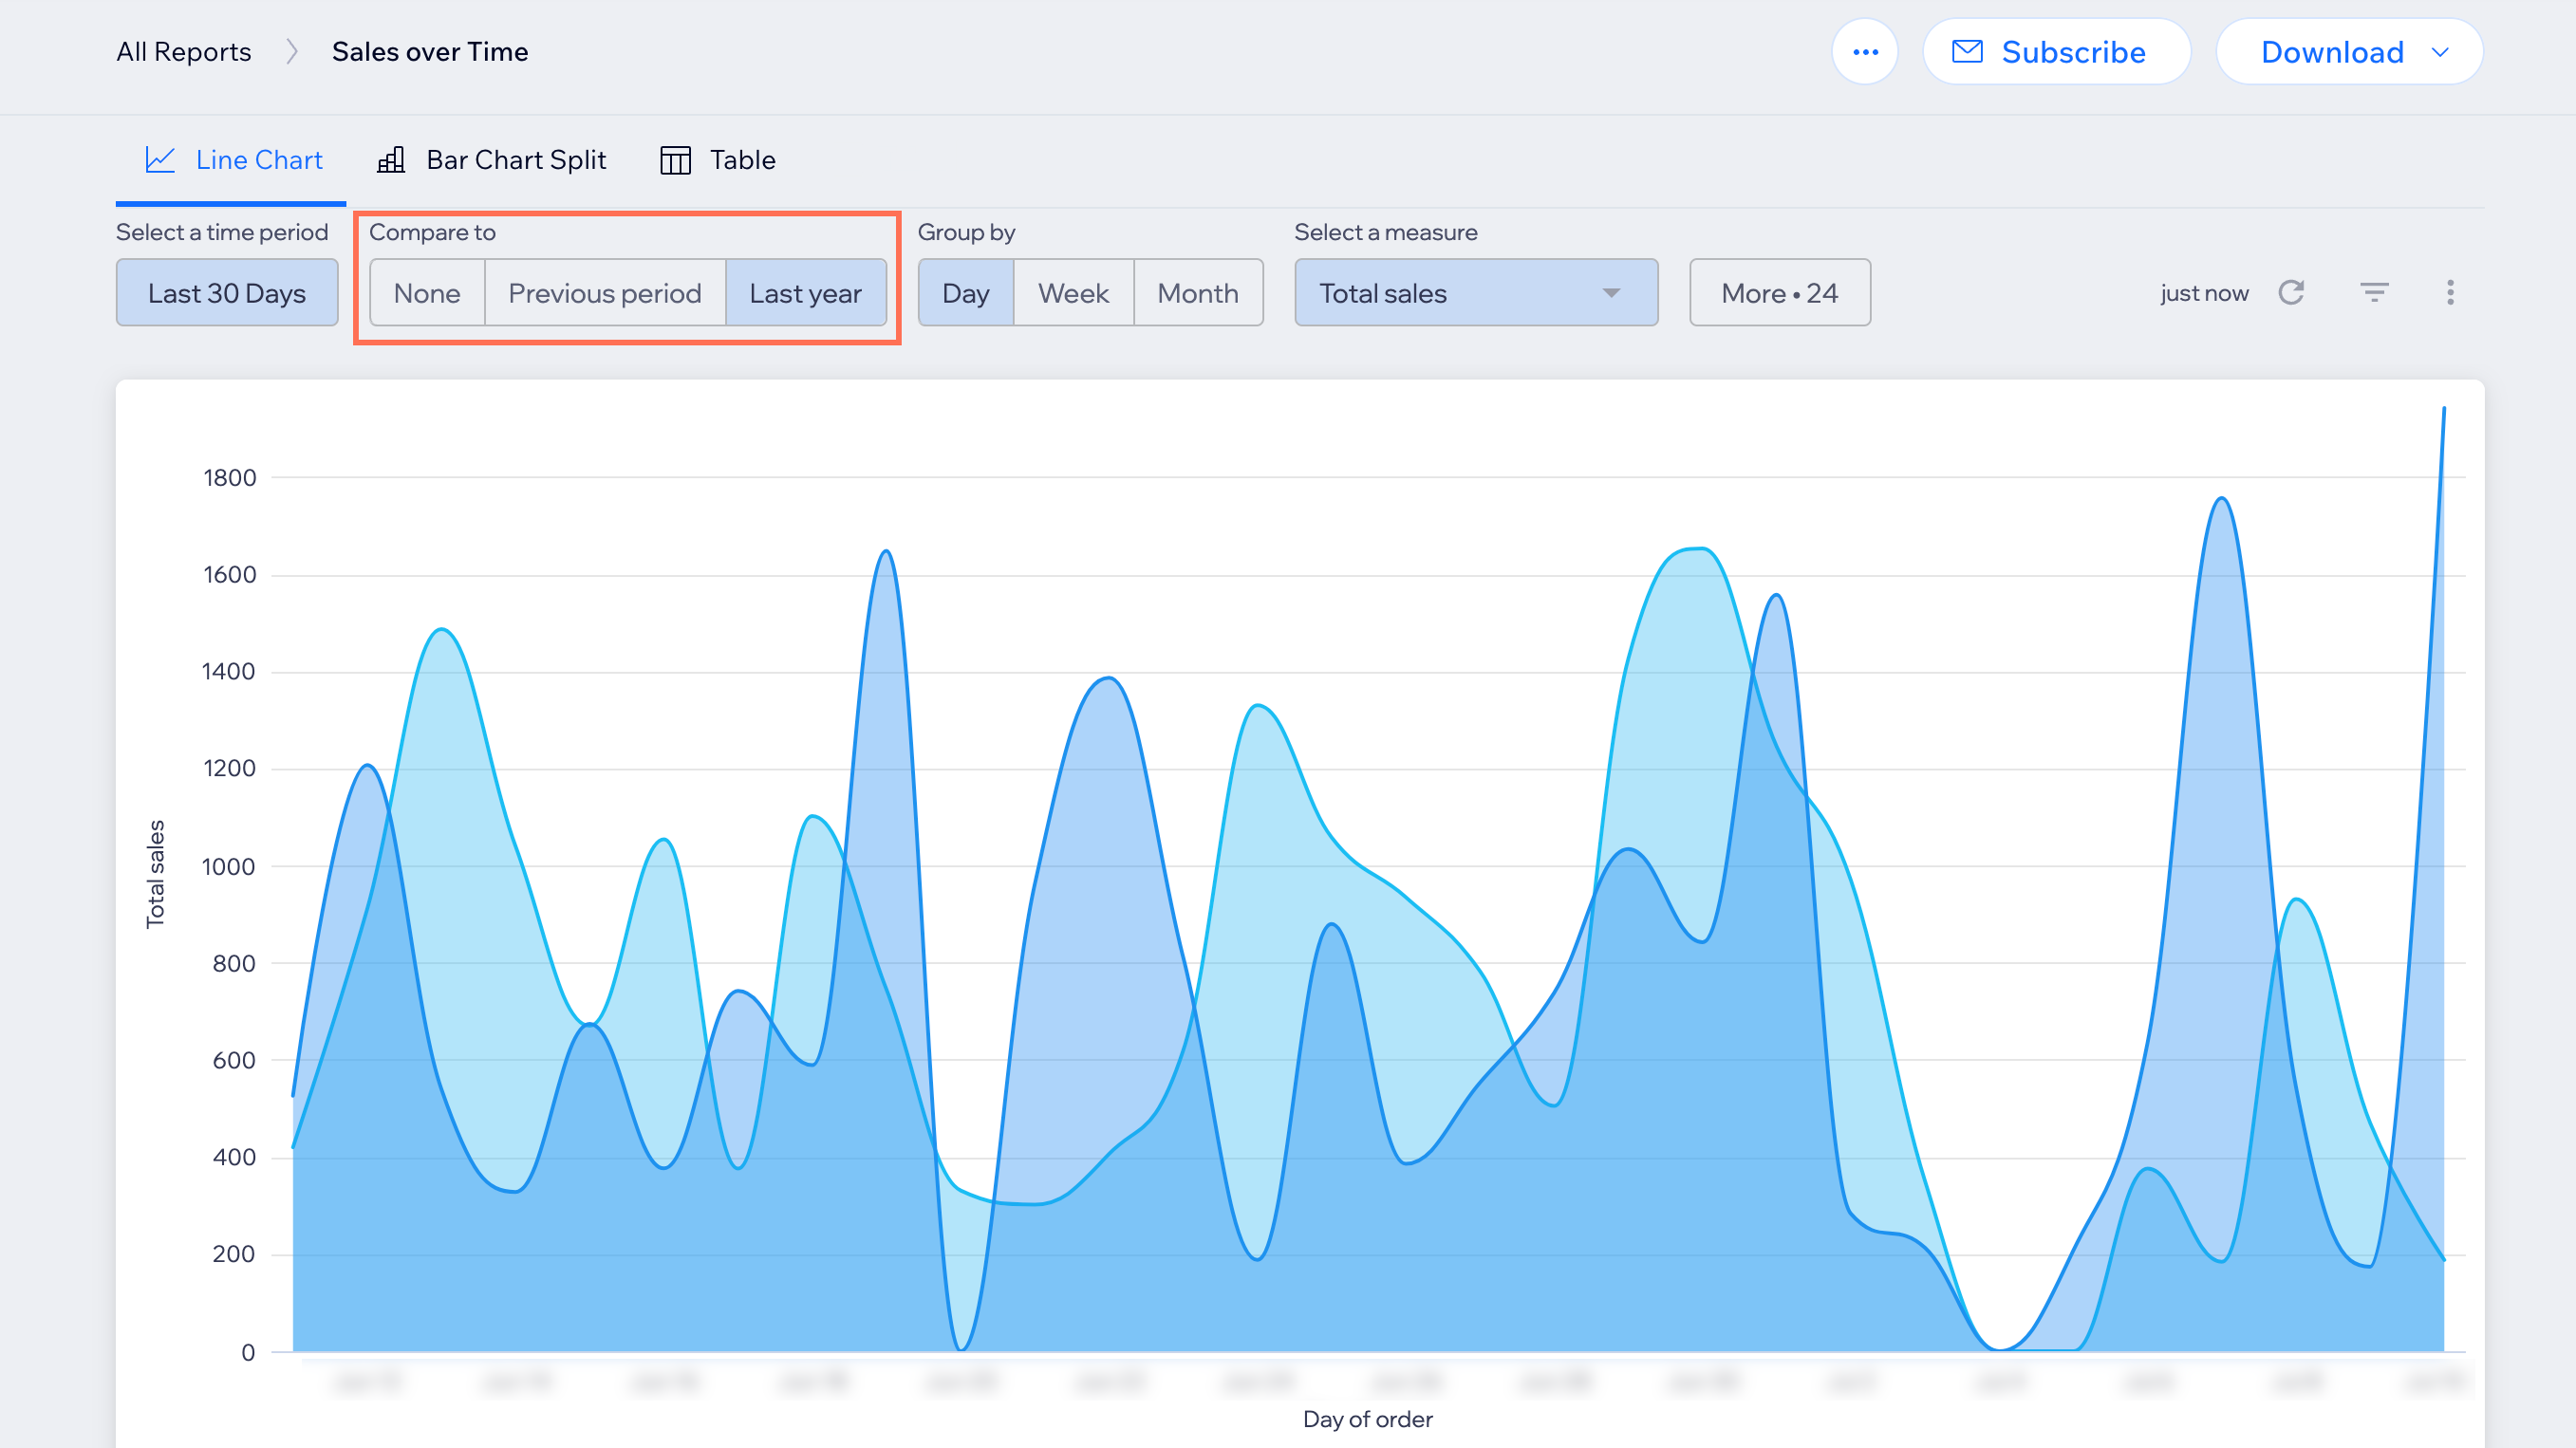
Compare report data from different periods to discover how your business has performed in different time periods. For example, when you access your Sales Over Time report, you can check how your online store did this year compared to last year.
To compare report periods:
Dashboard
Wix app
Wix Studio app
- Go to All Reports in your site's dashboard.
- Select an 'Over Time' report.
- Select a period under Compare to:
- None: Is selected by default, only shows the current selected period.
- Previous period: Compares the current selected period to the period before. For example, compare this month to the month before it.
- Last year: Shows how your data changed this year versus the year before.
FAQs
Click a question below to learn more.
Can I reset a report?
 in the report.
Can I create a new Analytics report?