Facebook Ads: Understanding Your Campaign Dashboard
7 min read
In this article
- The Dynamic Facebook Ads Dashboard
- Dashboard Components
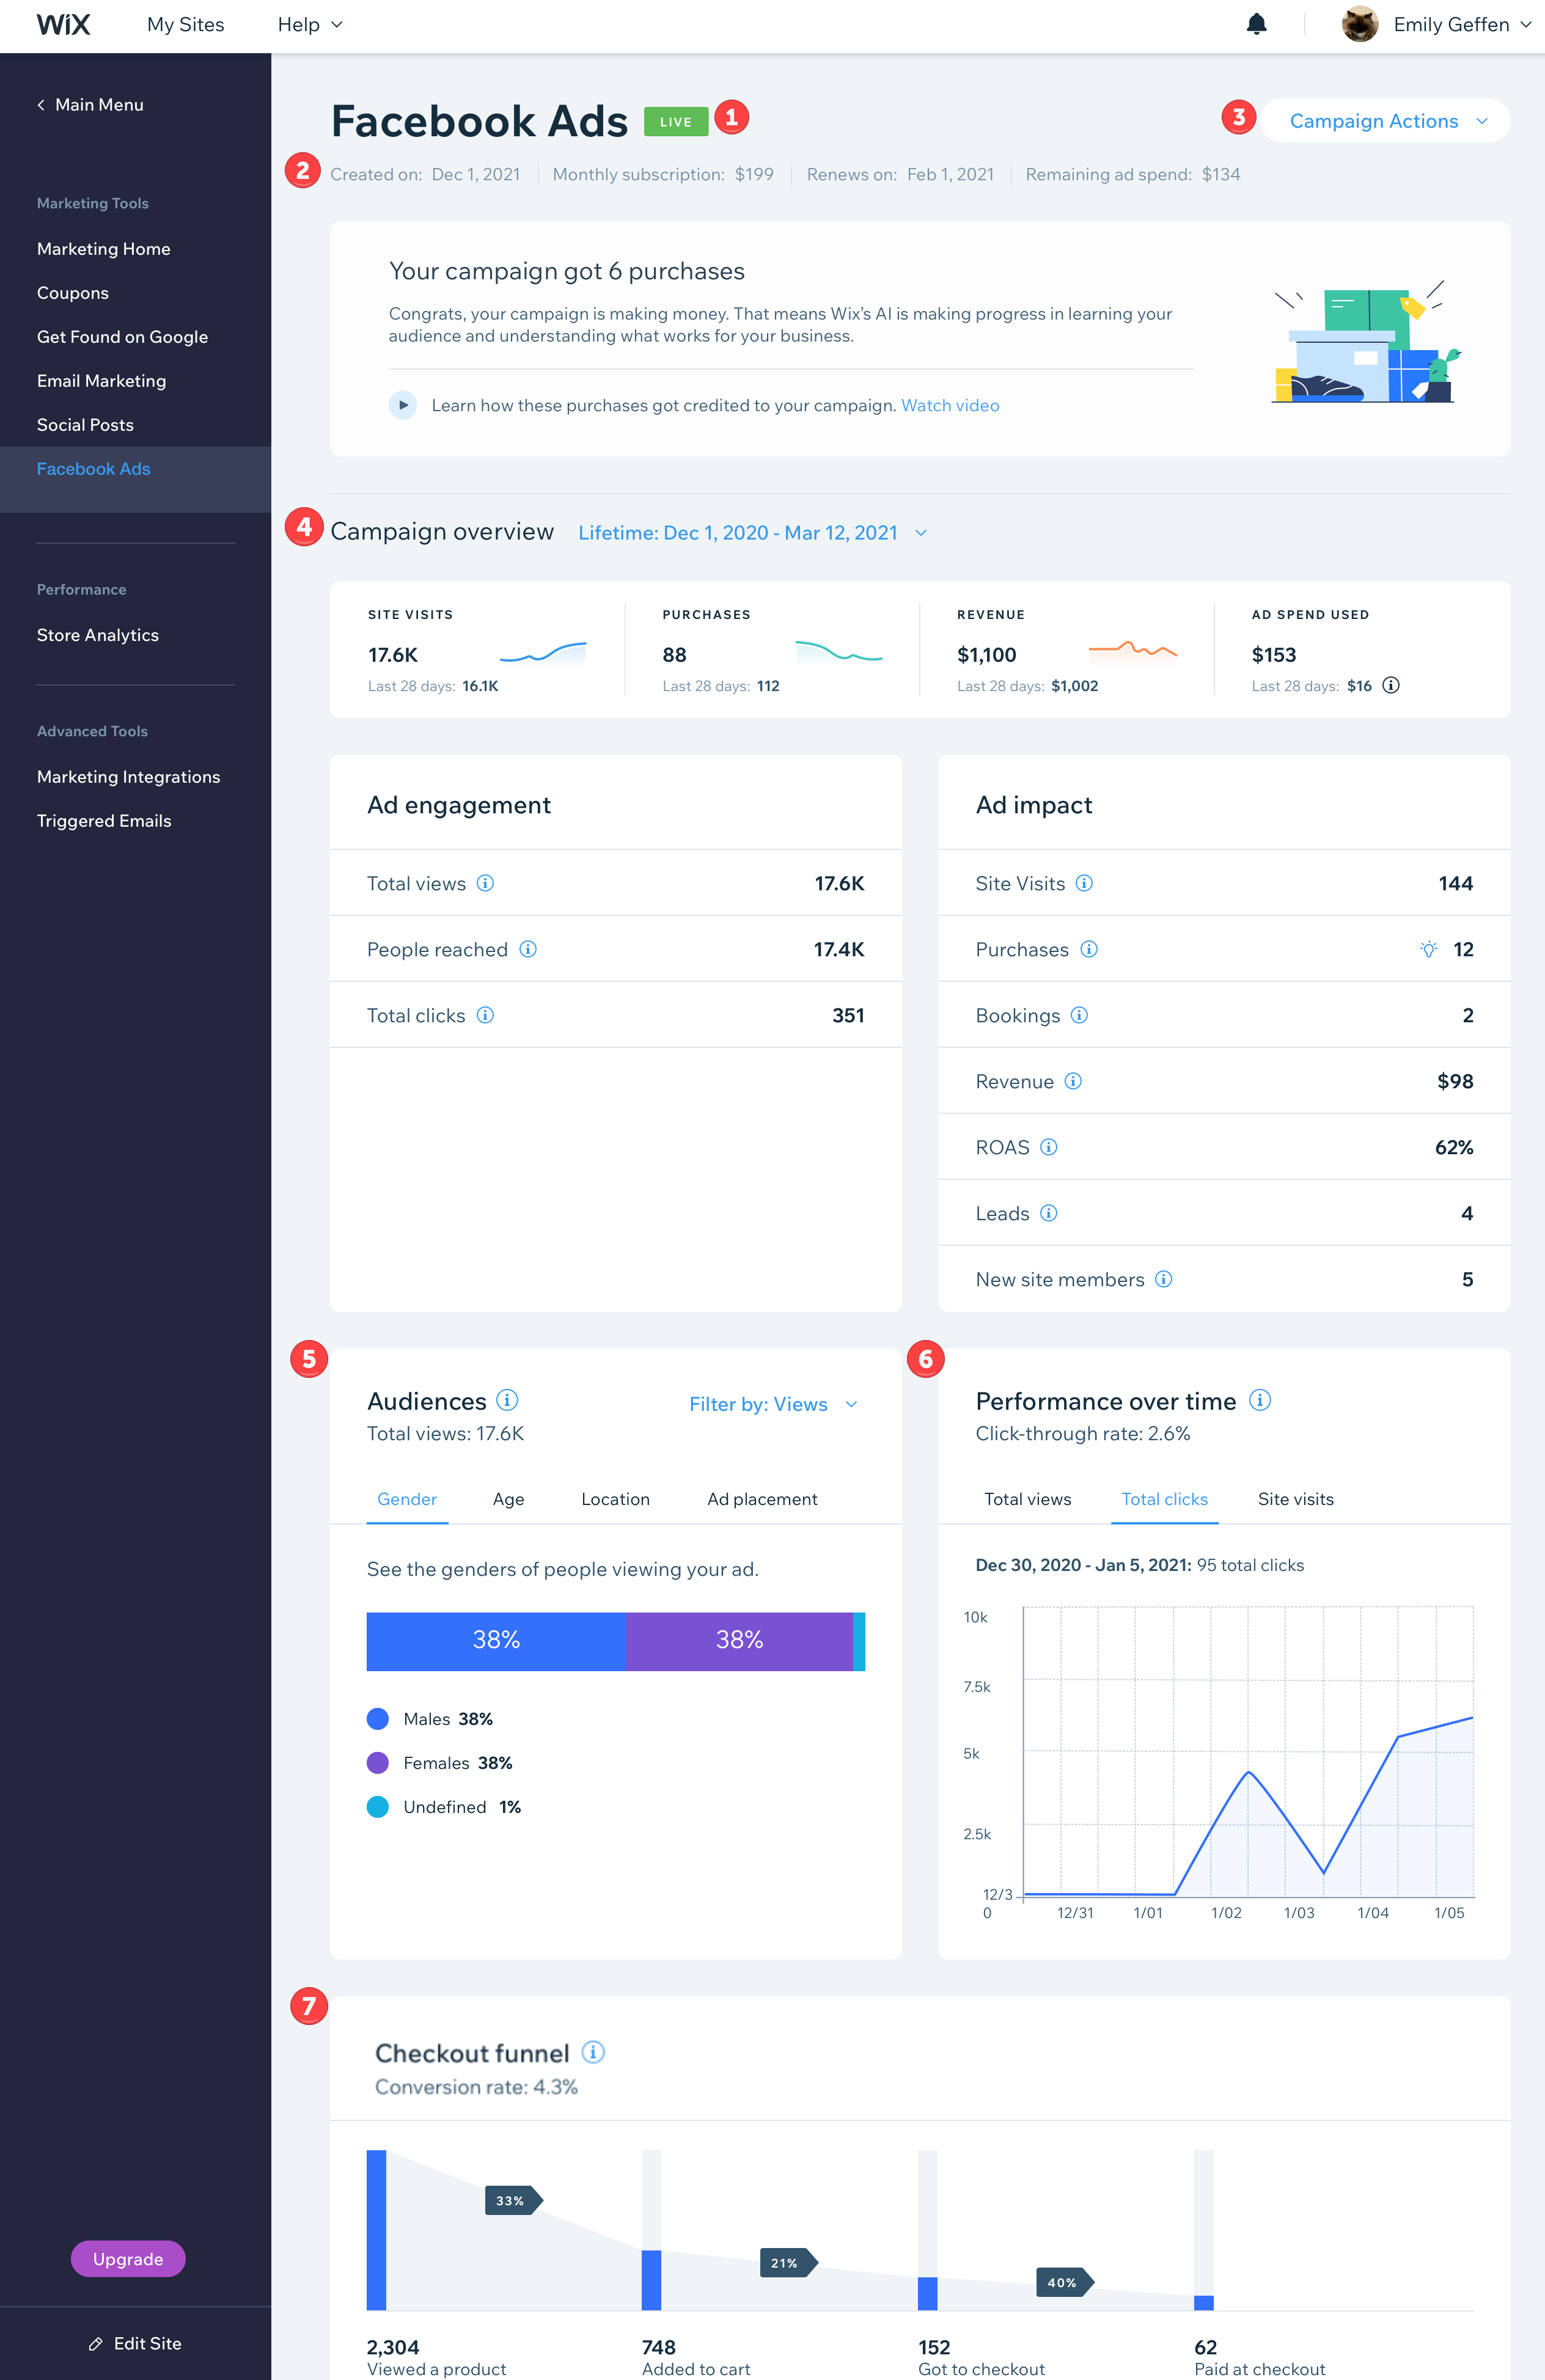
- 1) Dashboard Status
- 2) Campaign and Subscription Info
- 3) Campaign Actions
- 4) Campaign Overview
- 5) Audiences
- 6) Performance Over Time
- 7) Checkout Funnel
The Facebook Ads dashboard is the hub of your campaign activity and brings all the stats to your fingertips so you can make informed business decisions. Depending on your campaign goal the dashboard adapts to show the most relevant data. Campaign info is visually laid out so you can quickly glance at any component and understand how your ads are performing.
Learn more about:
The Dynamic Facebook Ads Dashboard
The campaign goal you set at the beginning influences what statistics you see on the Facebook Ads dashboard. The type of statistic and the data updates based on the reactions and activity your campaign is getting at the time.
For example, if you have Wix Stores and your campaign goal is 'more store orders,' the dashboard highlights purchases, revenue and ROAS (Return on Ad Spend). If your campaign goal is 'promote a page' the dashboard focuses on incoming traffic such as site visits, new leads and new site members.
Some metrics will always show regardless of the goal you chose. If you do not have Wix Stores but have another booking or service on your site, you may also still see purchases as one of your dashboard metrics if your site accepts online payments.
Dashboard Components
The Facebook Ads dashboard is broken into sections with similar statistics grouped together. Manage your campaign from the Campaign Actions dropdown, view campaign highlights under Campaign overview and dive deeper with sections for Audiences as well as Performance over time.
Note:
The dashboard pulls data from the lifetime of the campaign, even if you stop the campaign and later restart it. You can filter by different dates using the drop-down next to Campaign overview.

1) Dashboard Status
At the top of the dashboard is a colored label that shows your current campaign status. The possible statuses of a campaign are:

- In Review: When you first submit your campaign, it is reviewed by Facebook before it goes live.
- Live: Your campaign has been approved and is active and running.
- Paused: Your campaign is paused temporarily.
- Ended: Your campaign has ended and is no longer active.
- Error: There is an error preventing your campaign from running. If your campaign status shows Error, a message in your dashboard will explain the error in more detail as well as how to fix it.
2) Campaign and Subscription Info
Beneath the campaign status are your subscription details. Depending on your subscription, you may see different information.
- Created on: The date you first purchased a subscription for your campaign.
- Restarted on: If at any point you choose to stop your campaign and later want to start it again, this is the date your campaign restarted.
- Monthly subscription: The amount you pay per month (including Wix's 15% fee). If your subscription is in a currency other than USD, the remaining 85% is converted to USD to pay Facebook to run your ads.
- Subscription status:
- Renews on: The date your monthly subscription will renew.
- Expires on: The date your subscription expires. After this date, you will need to pay for a new subscription to run another campaign.
- Expired: The subscription has expired.
- Remaining Ad Spend: If you choose to end your campaign before the full amount is used, the leftover amount is known as your 'remaining ad spend.'
- If you restart your campaign before your subscription expires: The campaign begins where it left off, and uses the remaining ad spend to run the ad.
- If you restart your campaign after your subscription expires: You must pay for a new subscription before you can access the remaining ad spend. Once a new subscription is confirmed, your remaining ad spend is carried over and added to the new subscription.
Note: If you run your campaign in a currency other than USD, the remaining ad spend is an estimation. This is because Facebook Ads works in USD, so the amount has been converted from USD to your preferred currency. Learn More
3) Campaign Actions
The Campaign Actions drop-down is where you can make changes to your entire ad campaign.
- View live ad: See what your ad looks like on Facebook. If you have Wix Stores and are running dynamic ads, it shows one of the variations.
Note: If 'View Live Ad' isn't available the campaign is either in review or there is a technical issue that is making the link unavailable, even if the ad is still running. - Edit campaign: Edit the campaign content or audience. Learn more
- Change budget: Add or decrease your monthly subscription. Learn more
- Pause temporarily: Pause your campaign for either a pre-determined length of time or pause indefinitely. Learn more
- End immediately: End your Facebook Ads campaign. Learn more
4) Campaign Overview
The campaign overview takes up the majority of the dashboard and is separated into sections depending on the type of statistic. Notable stats are highlighted at the top.
Important:
Depending on your campaign goal and current campaign activity you will see different statistics. The below is a list of all the possible statistics you may see.
Ad engagement: How audiences are interacting with your ads.
- Total Views: The number of times your ads were on Facebook and Instagram. Facebook calls views "impressions", and the numbers are not unique. This means if one person saw an ad five times, it counts as five views rather than one.
- People Reached: The number of people who saw your ads at least once.
- Total Clicks: Includes clicks on your ad link, carousel clickthroughs for dynamic ads, as well as multiple clicks by the same person.
- Reactions: The total number of reactions on your ad including: Likes, Loves, Wow, Sad, Angry, etc. This includes reactions on Facebook and Instagram.
- Comments: The total number of comments on your ad. This includes comments on Facebook and Instagram.
- Shares: The total number of times your ad was shared. This includes shares on Facebook and Instagram.
Ad impact: How your ads are working for you.
- Site Visits: The number of times a customer reached your site after seeing or clicking your ad. If a person clicks on 3 different ads and sees 3 different pages, this counts as 3 site visits.
- Leads: People who filled out forms on your site and provided contact info.
- Site Members: How many new people signed up to your site.
- Purchases: The number of purchases you've received because of someone viewing your ad. These may include products, booked services, and any other site purchases. If you offer a free pricing plan, this also counts as a purchase. Learn how purchases are attributed to your campaign.
- Bookings: The number of bookings you've received because of someone viewing your ad. This includes both paid and unpaid bookings. Paid bookings also count as purchases.
- Revenue: The total earned from this campaign, including the Shipping Tax.
- ROAS (Return on Ad Spend): The total revenue generated by the campaign divided by the ad spend used.
5) Audiences
Get a good picture of who is seeing your ad, and which type of audiences are interacting with your campaign. Click the Filter by: drop-down at the right to change the audience statistics by Views, Clicks and Purchases. You can also click the Gender, Age, Location, or Ad placement tabs to view different audience groups.
- Gender: See the gender breakdown of people viewing your ads.
- Age: View how your audience is split by age group.
- Location: See the top geographical locations where people are viewing your ad.
- Ad placement: See what platform people are viewing your ads on. This could include Facebook, Instagram, Audience Network, Facebook Marketplace, Messenger and WhatsApp.
6) Performance Over Time
View how your ad is performing and how audiences are engaging with it over the time period you've specified in the date picker at the top of the dashboard. (By default it shows the campaign's lifetime statistics). Click the Total Views, Total Clicks and Site Visits tabs to filter your ad engagement over time by different metrics. You can also see your ad's click-through rate.
- Click-through rate (%): The amount of link clicks you've received on your ad divided by the amount of overall impressions your ad received. For example, if 100 people viewed your ad and 5 people clicked it, your click-through rate is 5%.
Note: If your click-through rate shows 0% your ad may still have views, but zero clicks.
7) Checkout Funnel
Important:
The checkout funnel section of the dashboard is only available for campaigns with the 'more store orders' goal.
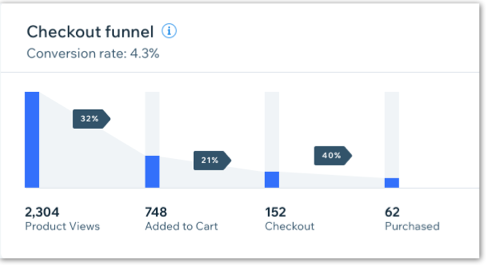
The Checkout funnel visually displays the customer journey from first viewing your ad all the way through to completing a purchase. At the top of the section you can also see your conversion rate. A conversion rate is the percentage of viewers who have gone all the way through the checkout funnel to take the desired action: making a purchase from your store.
- Product Views > Added to Cart (%): The percentage of people who viewed at least one product and added something to their cart. (32% in the below example).
- Added to Cart > Checkout (%): The percentage of people who added items to their cart and then moved to the checkout stage of the funnel. (21% in the below example).
- Checkout > Purchased (%): The percentage of people who got to the checkout stage and made at least one purchase. (40% in the below example).

Important Note on the Checkout funnel:
The Checkout funnel is not unique. This means if a customer makes two purchases during the 7 day attribution model, it counts as two actions in the funnel. For example, if one customer adds five of your store items to their cart and purchases one item, it counts as five Added to Carts and one Purchase in the Checkout funnel.
