

Wix Analytics: Customizing Analytics Reports
14 min
In this article
- Customizing your view
- Saving a custom view
- Managing custom views
- FAQs
Customize our pre-built reports so they show the info you need, in the format that works best for you. A clear view of your data helps you gain meaningful insights about your business and make data-driven decisions as a result.
When you open a report, you'll see data visualizations such as bar charts or line charts at the top of the page, with a detailed table view right below.
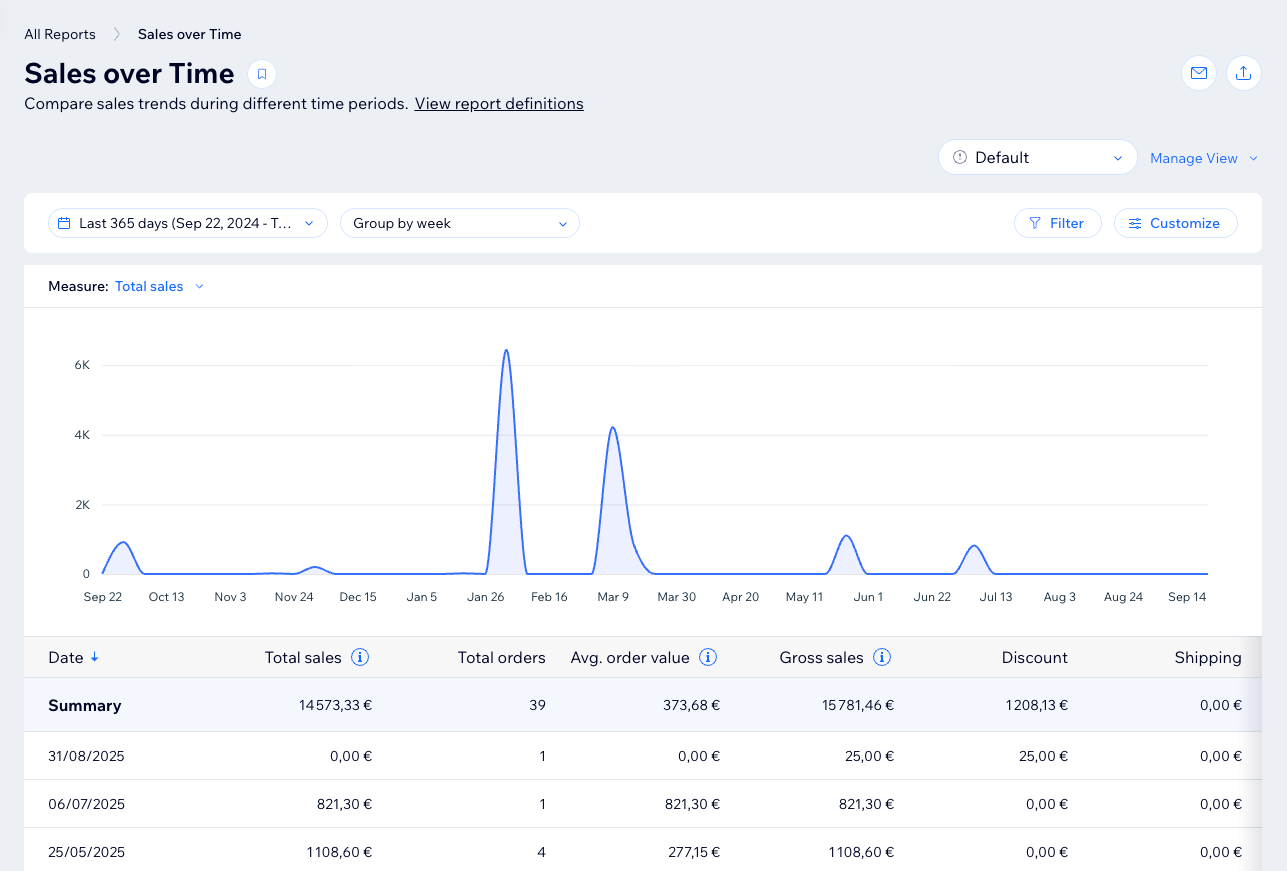
Customizing your view
Tailor the view to your specific needs by adjusting the report's time period, filtering with advanced metrics, adding columns, and more. For example, filter sales reports to see orders placed online in the last quarter or add columns in traffic reports to get more details on visitors' session length.
Note:
Some views limit the amount of data shown and how far back it goes. If you can't get to the data you need, use the table view below the chart.
To customize the report view:
Dashboard
Wix app
Wix Studio app
- Go to All Reports in your site's dashboard.
- Select the relevant report.
- Choose what you want to do:
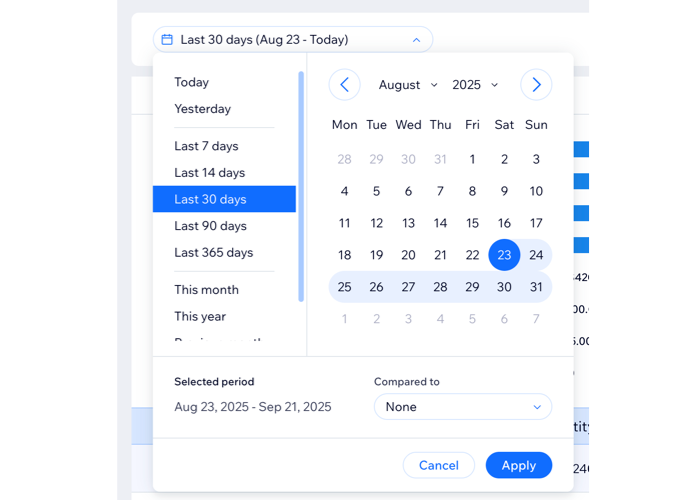
Change report dates
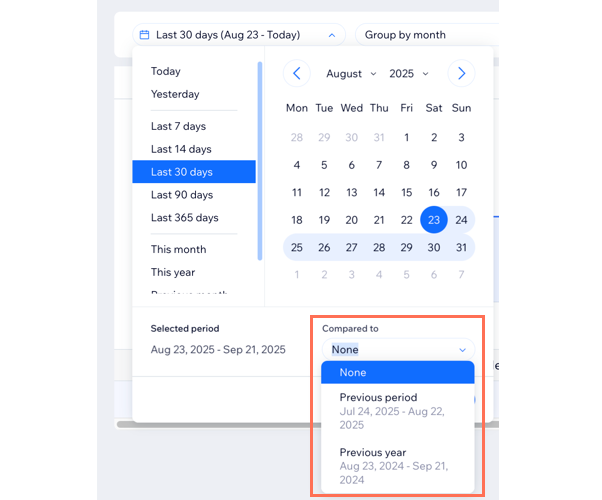
Compare report periods
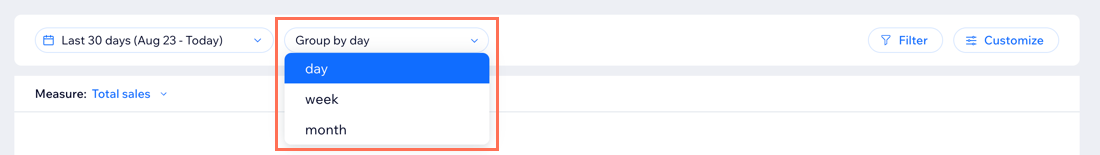
Group data by time period
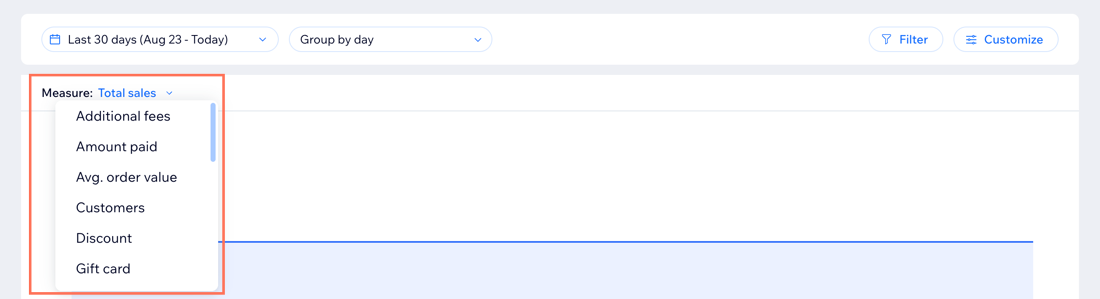
Select a measure
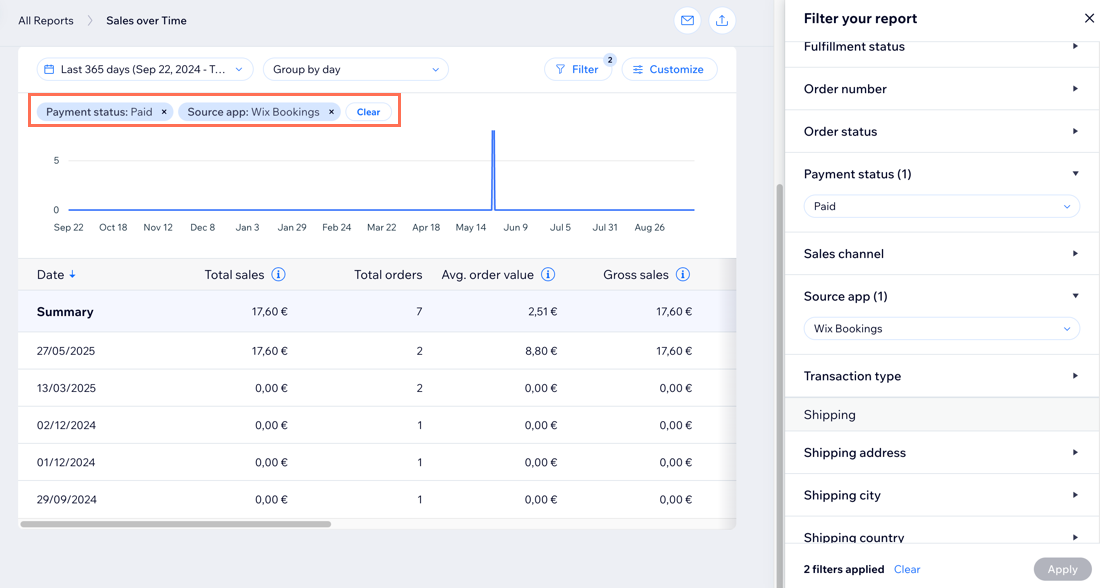
(Table view) Add filters
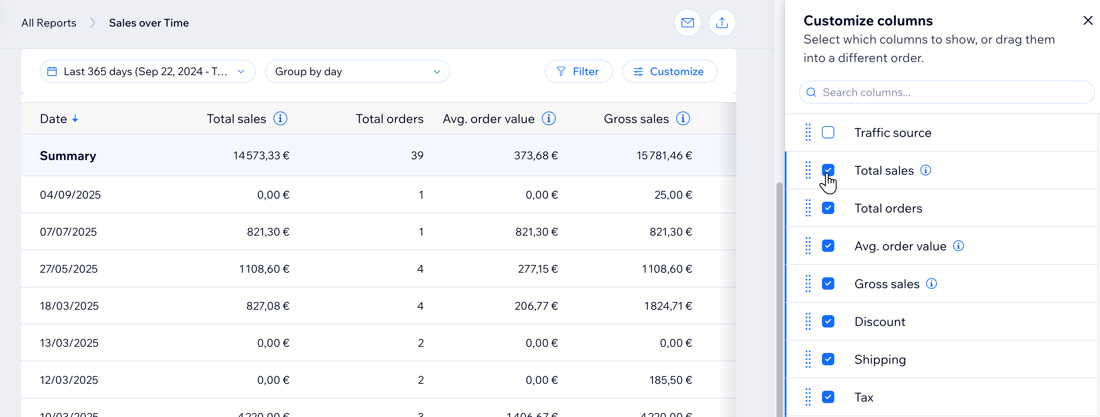
(Table view) Add or remove data columns
Tip:
Change the sort order of the table by clicking the arrow in the header. What the table sorts by depends on the report type.
Saving a custom view
Edit your view to display the fields and filters that work for you, then save that view so you can easily access it again. You can have multiple views to switch between, depending on the data you want to see.
To save a custom view:
- Go to All Reports in your site's dashboard.
- Customize a report's view as you wish.
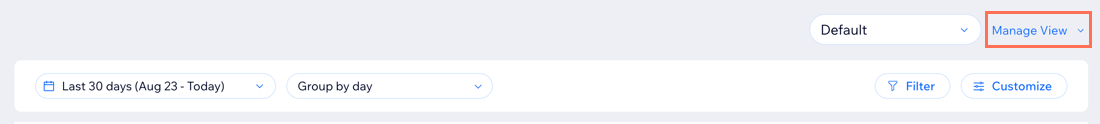
- Select Save as new view under the Manage View drop-down on the right.
- Enter a name for this new view.
- Click Save.
Managing custom views
Once you have saved report views, you can manage and edit them. Make changes to a saved view, choose which is the default view for the report, edit the name of a view, or delete a view.
To manage your custom report views:
- Go to All Reports in your site's dashboard.
- Select a report.
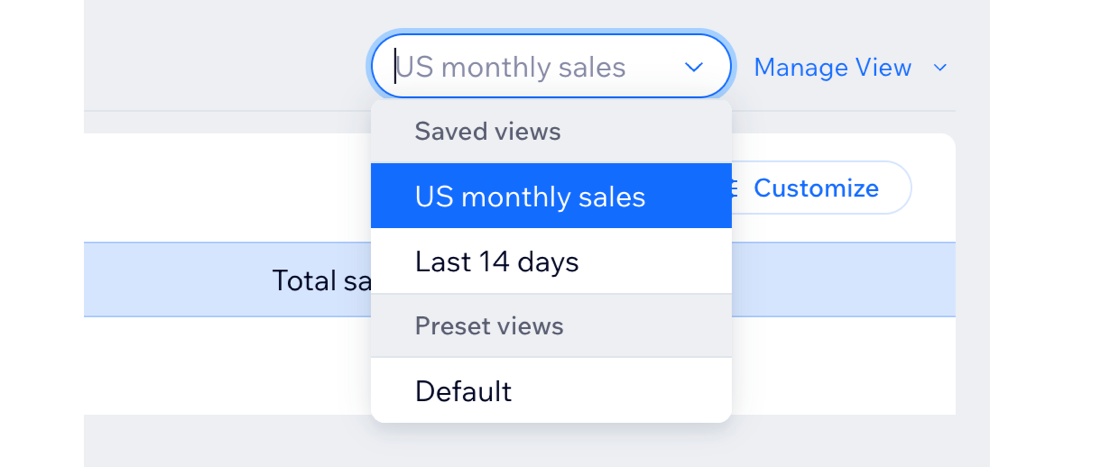
- Select a saved view from the drop-down.
- Click the Manage View drop-down on the right.
- Choose what to do:
- Save changes: After you make updates to a saved view, save those changes.
- Save as new view: Save the current view as a new, separate view.
- Rename: Rename a saved view.
- Set as default view: Make this the default view that appears when you select the report.
- Delete: Delete this view from the list.
What's next?
FAQs
Click a question below to learn more.
Can I reset a report?

Why are some columns or filters missing when I customize my report?
Can I share Analytics reports with my team?

Can I share a report view that I created?
Is there a limit of how many rows can be displayed in Wix Analytics table reports?
How does grouping by week or month affect the way my data is displayed for Bookings reports?