

Wix Blog: About Your Blog Analytics
6 min
In this article
- Your stats over time
- Average post views by time of day
- Posts by
- Google search performance
- Top traffic sources by views
- FAQs
Your Blog Analytics page gives you a clear snapshot of how your blog content is performing across traffic, engagement, and search visibility. Whether you're monitoring a recent campaign or analyzing long-term trends, this page makes it easy to spot what’s working and where there’s room to improve.
Optimize content strategy, posting times, and promotional efforts with real-time data for quick decisions and in-depth reports just a click away.
Tips:
- Use the date picker drop-down at the top to adjust the time period for the data you're viewing (the default is the last 30 days).
- Click View report in a section to get more data about that metric. Learn more about Blog reports.
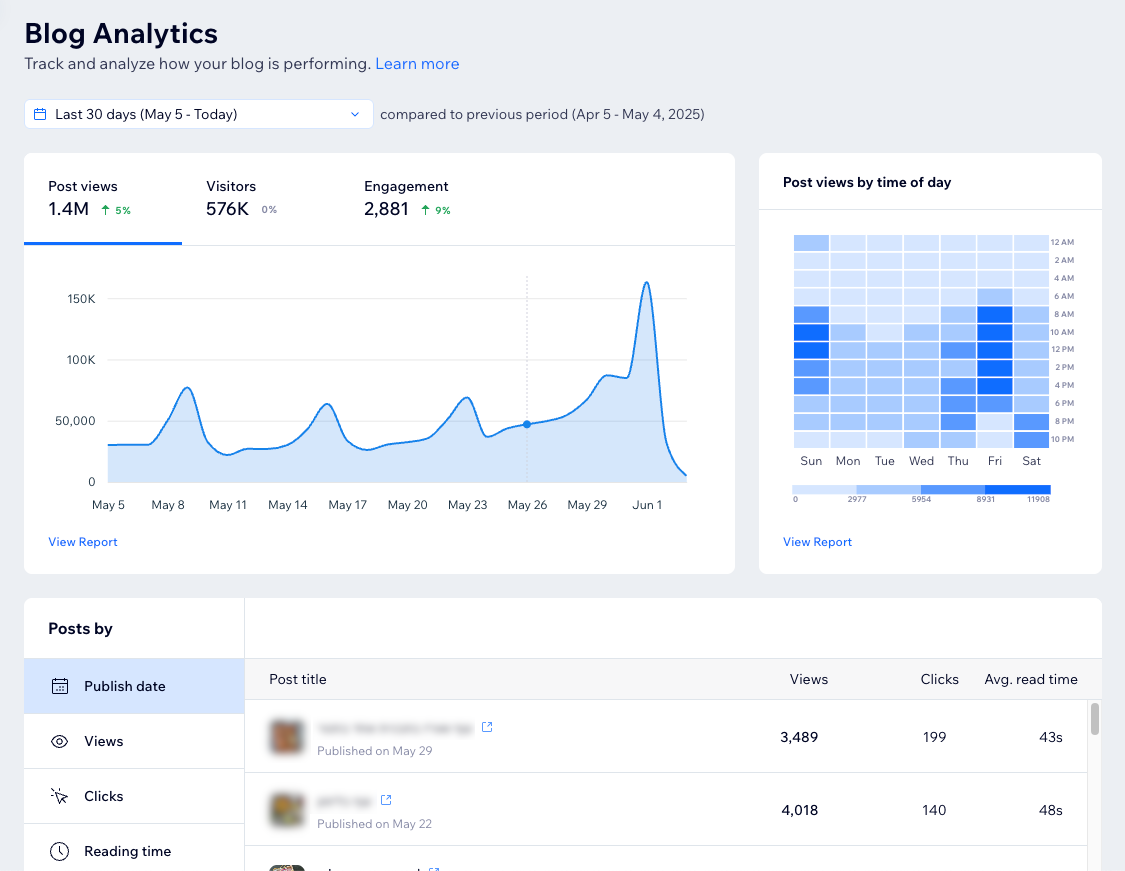
Your stats over time
This section lets you explore your blog's key metrics over time: Post views, Visitors, and Engagement. Click a tab to show the relevant data on the graph. Then, hover over the graph to see a specific stat for a certain day within the time period you defined at the top.

Average post views by time of day
Understand when your readers are most active by checking the average number of post views by time of day. Then, use this data to optimize your publishing schedule for peak reach.
You can instantly spot best performing and underperforming time slots by the darkness of the tile: lighter tiles indicate lower engagement while darker ones show higher activity. You can also use the legend below to interpret performance ranges. Hover over a specific time slot to see the exact average post views at that time.

Posts by
Analyze your blog's performance using specific metrics to compare data for individual blog posts. Only posts that received views during the selected time period are displayed in this section.
Select a metric under Posts by to organize your posts by:
- Publish date: The blog post's publish date.
- Views: The number of views on each blog post.
- Clicks: The number of clicks a blog post received.
Tip: Enable button click tracking to track button clicks on your site. - Reading time: The average time it takes to read the blog post.
- Engagement: The amount of engagement a blog post gets. This includes the number of likes, comments, and shares.
- Categories: The categories you created to sort your blog into different topics. Posts without a category appear under Uncategorized.
Note: Posts can also appear in multiple categories if they are assigned to more than one category.
Note:
This section shows you the top 50 posts for each metric (e.g. views, clicks). To see more posts, visit the relevant report by clicking View Report at the bottom left.

Tip:
See how you can replicate elements from your top-performing posts to further improve your blogging strategy.
Google search performance
Use this section to get insights into how well your blog posts are performing on Google, based on clicks, impressions, and click-through rates (CTR). See which posts are performing well so you can build on their success and create more content that your readers will love. Use these insights to fine-tune other posts and boost your visibility on Google search results.
By default, the section sorts the posts by the number of clicks, however you can sort by impressions or CTR instead. Learn how to connect your site to Google Search Console.
Tip:
Google updates this data every three days. The timestamp at the bottom right shows Google's last update.

Note:
We track any blog posts that contain /post/ or /single-post/ in their URL. If you manually change this prefix, the blog post won't appear on the Google Search Performance tile. However, it will still show up in your 'Top pages in Google Search results' report.
Customizing the prefix means changing the bolded part of this URL structure: https://domain.com/post/{post slug}. Learn more about default URL structures.
Top traffic sources by views
Discover where your blog traffic is coming from, broken down by source and category. This information is helpful for understanding performance by channel and helps prioritize your promotional efforts. For example, if traffic from social media channels is higher than other sources, you can put more effort into campaigns there.
Click the All posts drop-down to filter by post and see which traffic sources contributed to specific content performance. You can also use the search bar to quickly find a specific post.

Note:
Sessions that can't be identified in this section are listed under Unknown.
FAQs
Click a question below to learn more about your blog analytics.
Where can I learn about terms used on this page?
Why do I see discrepancies between Blog Analytics and other pages?
Why can't I see the option to sort posts by category?
Can I access this page on my mobile app?
 at the bottom. Then tap Blog and then Analytics.
Hire a Professional WriterGet the content you need for your website. Hire a writer from the Wix Marketplace to create text that fits your message and brand.