
Wix Blocks: Debug Your Code
7 min
In this article
- Debugging with the Developer Console
- Viewing the developer console
- Filtering console messages
- Functional Testing for Backend Functions
- HTTP Functions
- Debugging with Your Browser's Developer Tools
- Accessing Client-Side Source Files
- Method 1: Search for your file by name
- Method 2: Use the debugger
- Backend Code and HTTP Functions
- Debugging with Logs
- Live Site Events
- Google Operations
- Logging Messages to the Console
- Bypassing permissions with wix-auth elevate()
This article applies to debugging your code in Blocks or a site where your app is installed.
Debugging with the Developer Console
The Wix Developer Console is available at the bottom of the page when you are previewing your site, and also in Blocks. The console displays useful debugging information, such as errors, warnings, and other messages.
The console also displays debug messages that you added to the code using any console method. If you are new to debugging code, learn more further in this article.
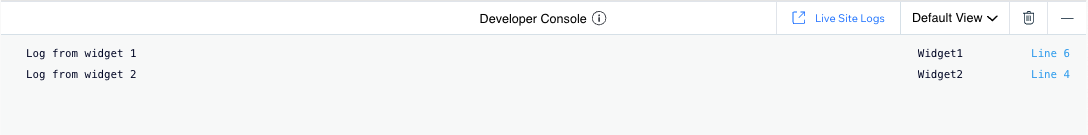
In Blocks: Each message displays the widget where the relevant code can be found and a clickable link to the specific line of code that triggered the message.
In Preview mode in the site editor: You see only the message.
Viewing the developer console
To view the Developer Console, open the app in Blocks and click Preview. The Developer Console appears at the bottom of the page.
If the console is minimized, click the arrow  to expand it.
Filtering console messages
Click Default View on the console menu bar, and then choose which kinds of messages you want to see.
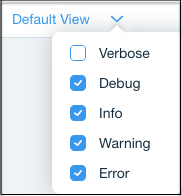
- Verbose: System log messages that can help you debug low-level code problems.
- Debug: Messages you have logged to the console.
- Info: Informational messages that require no action.
- Warning: Messages about potential problems in your code. These are highlighted in yellow.
- Error: Messages about actual errors in your code. These are highlighted in red.
Functional Testing for Backend Functions
Debugging code from the backend is challenging because you need to invest effort to trigger the code and test it, such as calling functions from the client side on a test site where the app in installed. To save you time and effort, Velo enables quick testing of backend functions directly from the code panel. The output you see in the test tab is the same as the output you would see in the Developer Console if you previewed your app and triggered the function.
HTTP Functions
You can debug HTTP functions by adding console.log() calls to them. The information you log appears in the function output when using functional testing.
Debugging with Your Browser's Developer Tools
Tip
Use the following debugging methods to debug your code on a site where your app is installed. You can also debug directly in Blocks, but debugging from the site will show a fuller behavior.
Velo allows you to debug your app’s code as you would any modern JavaScript web-based application, by using developer tools to set breakpoints, log to the console, and more. These tools are not part of Wix - they come with your browser. If you are new to debugging, learn how to log messages to the console. You can debug your fully published site's code directly, or create a test site and use it.
Here are a few things you need to know before you start debugging:
Accessing Client-Side Source Files
You can open a copy of your app’s client-side code files in the browser's developer tools.
There are two easy ways to locate your code:
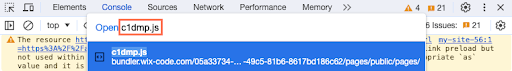
Method 1: Search for your file by name
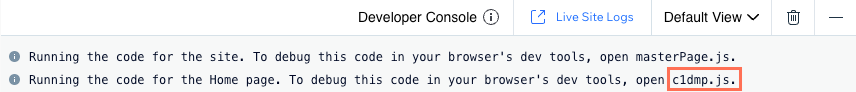
- Identify the names of the files that contain your app’s client-side code. The names of these files appear in the Wix Developer Console when you preview your site.
- Browse to your published site and open your browser's developer tools.
- Open the file search bar. To do this in Chrome press command/Ctrl+O. In Firefox, open the Debugger panel in the developer tools and press command/Ctrl+P.
- Type the name of your code file and select it from the search results to open it.
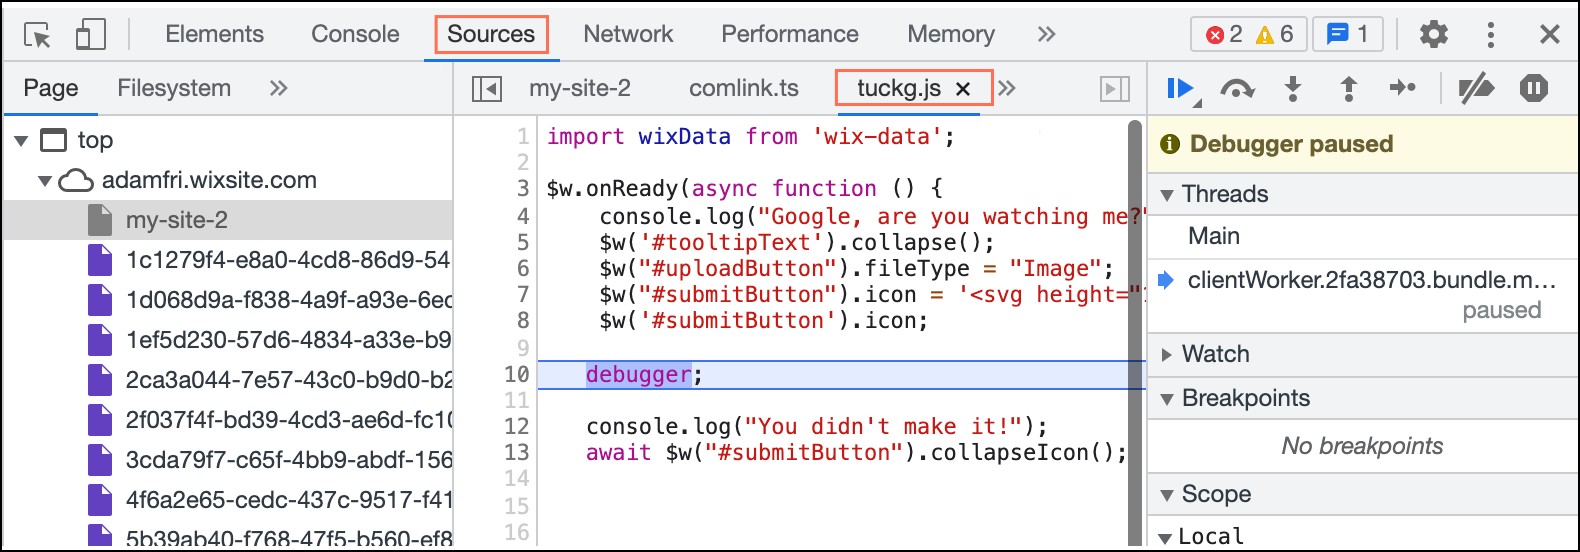
Method 2: Use the debugger
Adding the debugger statement to your code halts code execution at that point and prompts your browser to display the code file in developer tools.
- Add debugger; at the point in your code where you want the debugger to run.
- Open your browser's developer tools and browse to your published site. The Sources panel opens to your code file and points to the line where you added debugger.
Backend Code and HTTP Functions
Because of security concerns, messages in backend code are not logged to the browser's console on the published version of your site.
Because HTTP functions are not browser based, messages are not logged to the console when viewing the published version of your site.
You can use Logs to view console messages in backend code and HTTP functions on the published version of your site.
Note: source maps
Debugging with Logs
Wix's Logs tool allows you to debug your installed app by generating and tracking logs. You can access the Logs tool directly from Preview mode in the site where your app is installed. To get to the Logs tool, click on Live Site Logs in your Developer Console.

Notes:
- You can use site logging to generate logs from client-side code, backend code, public code, HTTP functions, or anywhere else in your site.
- You can monitor site logs in both Preview mode and on your published site.
You can also access the Logs tool in the Velo sidebar, under Developer Tools (Wix Editor), or in your site's dashboard, under Settings.
Live Site Events
You can view event logs in real time in the Site Events window. Simply add a console message to any code in your site, trigger the code in Preview mode or on your published site, and the log will appear in your Logs site events window.
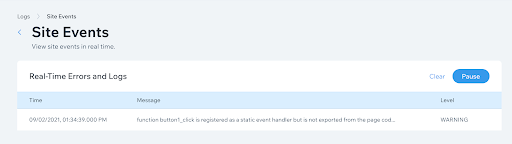
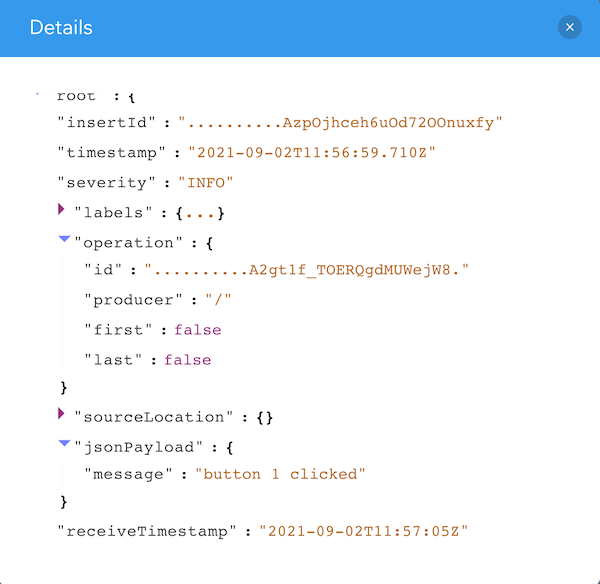
You can click the log to view more information:
Google Operations
For more robust log analysis, you can easily connect your Wix site events to Google Operations, an external monitoring tool.
Learn more about:
Logging Messages to the Console
- Add any console message to the code you want to debug.
For example, let's say you have a function called myFunc() that performs an operation on a variable called myVar. You want to check whether the function is being called and whether the operation on the variable is performed as expected. You can add the code below to your function. When the console message runs, the text within the quotes will be displayed, as well as the value of the myVar variable. console.log("Inside myFunc(). Value of myVar is: ", myVar);- In Preview mode or on your published site, perform whatever action will trigger myFunc().
- View the message in your tool of choice (Developer Console, Developer Tools, or Logs) to gain insight on how your code is behaving.
Note
If you log nested data to the console only the first 5 levels will appear in detail. To get detailed information on more deeply nested items, log them directly.
Bypassing permissions with wix-auth elevate()
If you are receiving a 403 or FORBIDDEN error when you run a function, try using the elevate() function to bypass permissions.