

Wix Analytics: Understanding the Behavior Overview
5 min
In this article
- Behavior Overview sections
- Top stats
- Top clicks
- Top pages
- Top navigation flows
- Form submissions
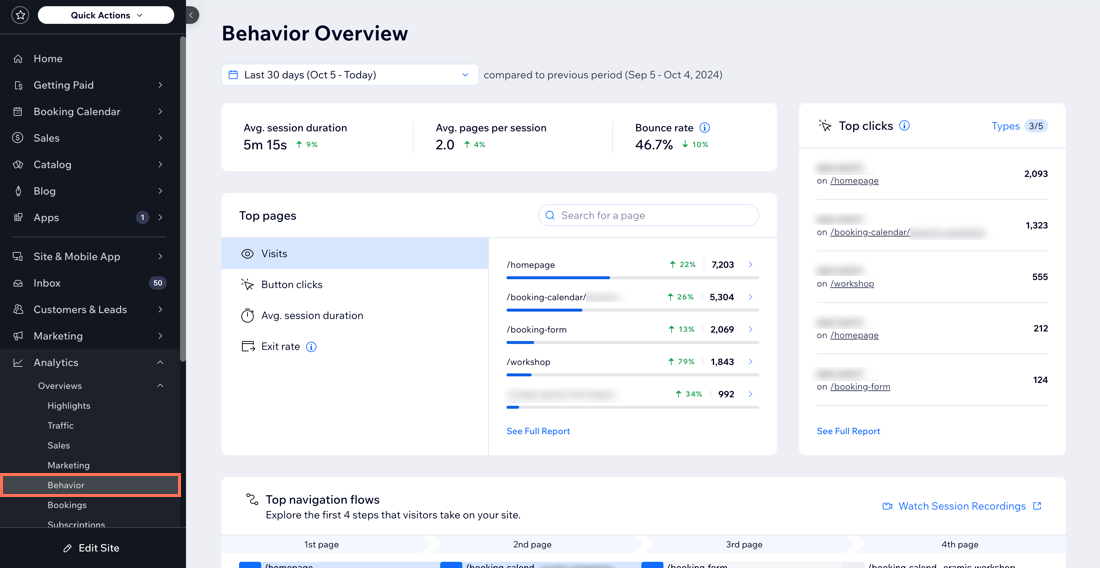
Your Wix Analytics Behavior Overview shows how your visitors engage with your site, with links to full reports for deeper analysis. Reveal valuable insight on how visitors interact with your site, your top pages, top clicks, and more.
You can find the Behavior Overview page in the Overviews section under Analytics in your site's dashboard.
Note:
Only data from tracked sessions is visible in this report. That means that traffic from any visitors who have not accepted the site's cookies (or are using certain types of ad blockers) won't appear. This includes all info about sessions, device, location, and more. If you see discrepancies in your site (e.g. someone purchased an item from your store but you can't see the site session) this could be why.
Behavior Overview sections
The Behavior Overview is broken into sections, based on the type of traffic you want to analyze. The top sections summarize all your visitors' engagement including top clicks and top pages. The sections below show the top navigation flows and data on form submissions.
Tips:
- Click the date picker drop-down at the top of the Behavior Overview to change the time period that data is pulled from (the default is the last 30 days).
- The percentages next to the stats indicate an increase (green) or decrease (red) in the data, compared to the previous time period.
- Click See full report in a section to see an in-depth report about that activity.
Top stats
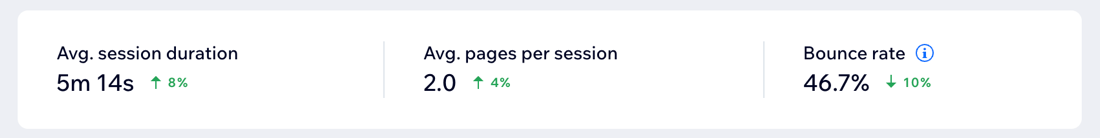
The Top stats section shows you how long visitors stay on your site and how many pages they tend to view before leaving. A site session is defined as a visit to your site, and it ends after 30 minutes of inactivity.
In this section, you can see the following stats:
- Average session duration: The average time people spent on your site.
- Average pages per session: The average number of pages people visit during a session.
- Bounce rate: The percentage of visitors who left your site after viewing only one page. Monitoring your bounce rate can indicate when you need to optimize content and improve first impressions.
Top clicks
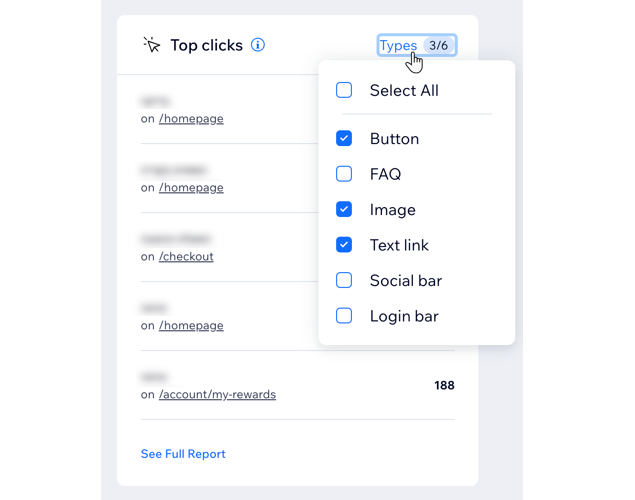
The Top clicks section shows an overview of the most clicked elements on your site. It provides insights into what elements site visitors engage with the most, helping to identify areas of interest or successful calls-to-action.
Click the Types drop-down to select the element types you're interested in. The following elements can be tracked: buttons, text links, images, FAQs, social bars, logins, and files.
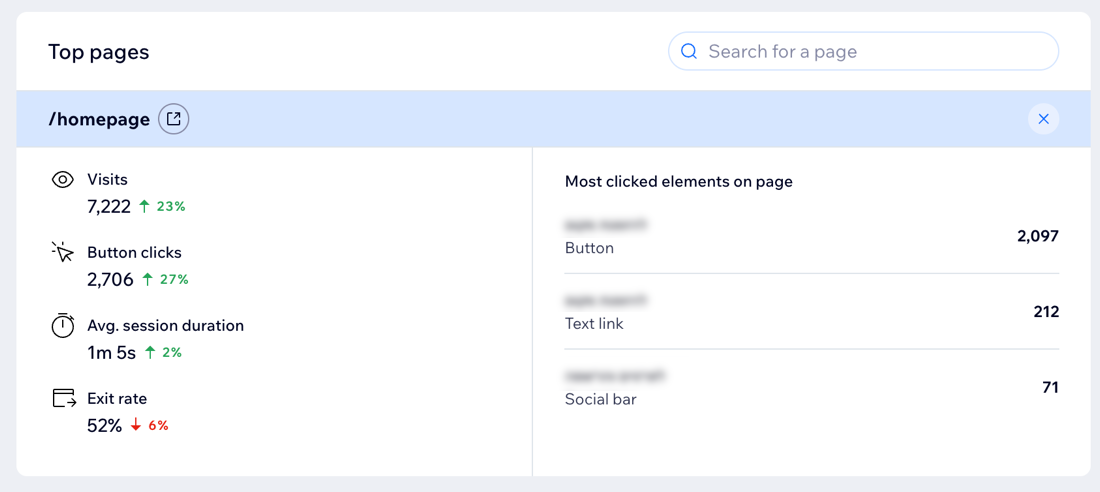
Top pages
This section displays a summary of your most popular pages. It allows you to see which pages drive the most traffic and user engagement.
The following metrics are displayed:
- Visits: Shows the pages on your site that receive the most traffic. By identifying your most visited pages, you can prioritize your efforts where needed most to elevate user engagement.
- Button clicks: Shows which pages receive the most button clicks. This helps in deciding how to optimize content to increase conversions.
Tip: Select a page to view the most clicked elements on the page. - Average session duration: Highlights the pages on your site which visitors spend the most time on. This allows you to understand which of your pages have the highest hold on your visitors' attention.
- Exit rate: Shows how often visitors leave the site after viewing a certain page. Use this page to map potential issues and improve the visitor's final impression of your site.
Tip:
Use the search bar to see how a specific page is performing.
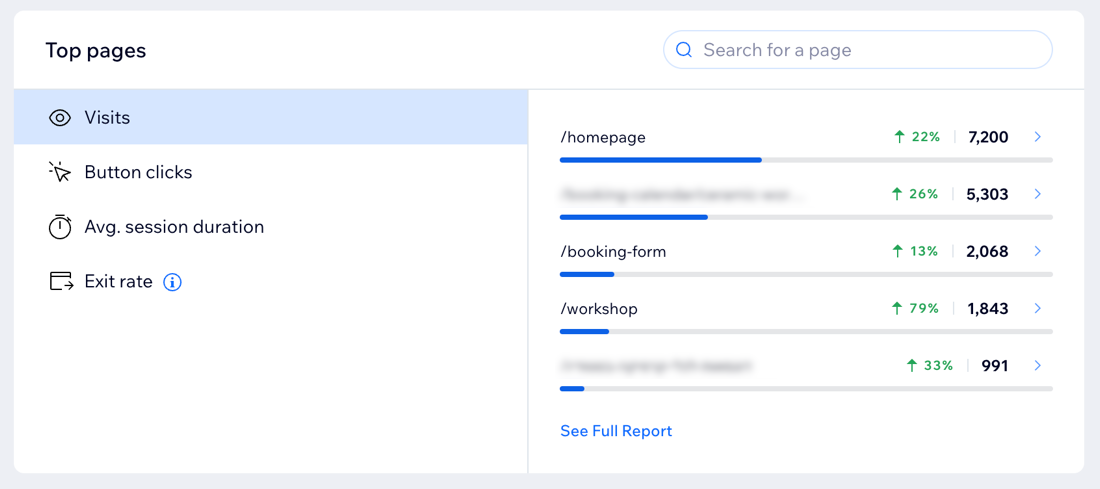
Click a page to view stats just for that page. On the right you see all the available metrics, and on the left you see the most clicked elements on the page.
Note:
Only pages that were visited in the last 30 days are shown here.
Top navigation flows
The Top navigation flows graph illustrates the first four steps that visitors take when navigating your site. Use this graph to study your visitor's browsing habits, then optimize your site to guide them where you want them on your site to boost conversion.
For example, if you notice that visitors tend to visit your "About" page immediately after your home page, placing a call-to-action button on the "About" page can drive sales.
The default path shown in dark blue is the top path. Click the light blue paths to highlight additional navigation paths. The bottom grey sections under each column show where site visitors dropped off completely.
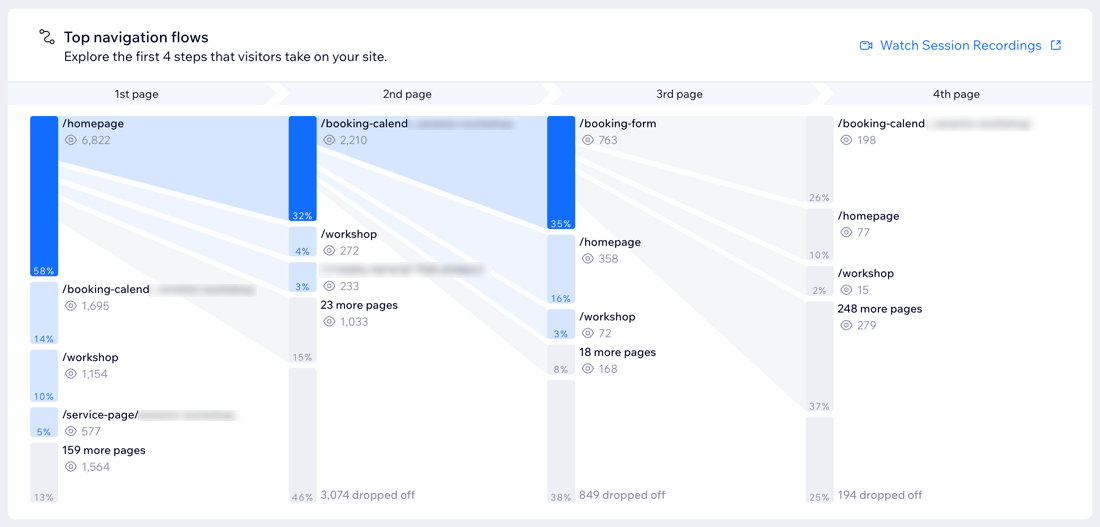
Review recordings of visitor sessions:
Understand how visitors interact with your site with Session Recordings. Click Watch Session Recordings to view sessions for these navigation paths. If you don't have it enabled yet, click Get Session Recordings below the section to start using it.
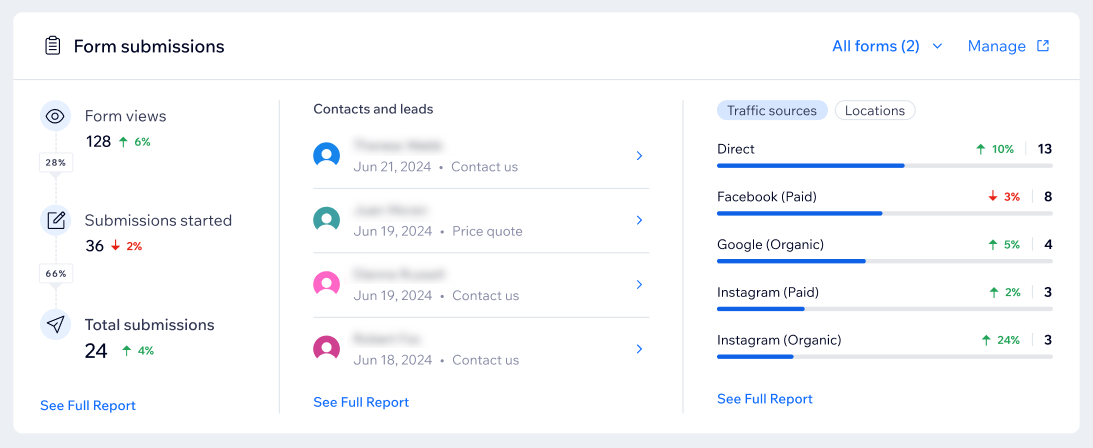
Form submissions
This section provides an overview of form submission metrics, showing the number of views, submissions started, and total submissions. This is valuable to track engagement with forms on your site, and for identifying effective traffic channels for lead generation.
You can click the All forms drop-down to select a specific form to view its stats. Click Manage to go to your Forms and Submissions page to manage and edit your forms, and view form submissions.
Under Contacts and leads, you can see the contacts and leads that were collected through forms and Wix Chat. Click a contact name to open their contact panel to take further actions such as contacting them or viewing their activity on your site.
The section on the right provides additional insights. Traffic sources show the sites that site visitors came from before submitting a form. These include referring sites, such as Facebook or Google. Locations show the physical location of users who submitted a form.
Note:
Form views and Submissions started on the left are only available for new Wix Forms. If you use old Wix Forms, you will see these metrics greyed out. Learn more about the difference between new and old Wix Forms.