

Enterprise Solution: Viewing Your Sites' Analytics
3 min
In this article
- Explore key metrics over time
- Customize your table and metrics
- Access site level analytics and reports
- FAQs
View data summaries for all of your sites with analytics for Wix Studio's enterprise solution. Explore your sites' overall performance, and drill down into your analytics data for each site. Customize your overview dashboard so you can keep track of the data you're most interested in.

Learn more about Wix Studio for enterprise or contact our sales team.
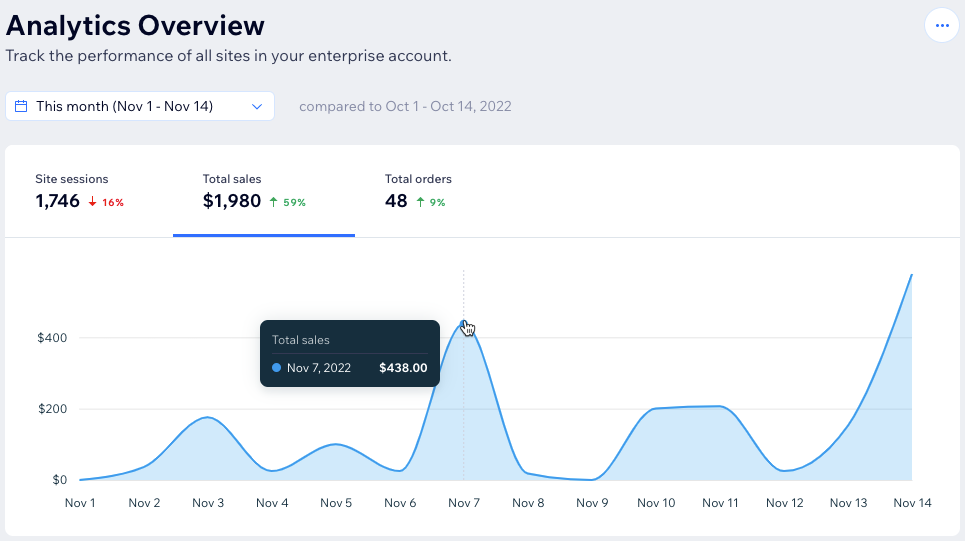
Explore key metrics over time
The Analytics Overview graph displays the performance for all of your sites over time. By default, the graph displays site sessions over the last 30 days, and compares your data against the previous period. Change the date period and use the tabs in the report to switch between metrics to explore total sales and total orders.
Ready to get started?
You can access your Analytics Overview from the enterprise dashboard.
Customize your table and metrics
The Analytics Overview table provides details on how each site is performing. Customize your table to display the data and key metrics you want to see. Add and remove columns to monitor trends in visitor behavior, sales, and traffic data. You can also export a .CSV file with stats for all of your sites or specific ones in the selected time frame.

Looking for a specific site?
Use the search field and enter the site's name.
Access site level analytics and reports
Access detailed site level analytics and reports for each one of your sites with Wix Studio for enterprise. Drill down into each site's performance with site traffic, sales and customer behavior metrics.
Each overview is presented in tiles to allow your most important data to be available to you at-a-glance, and you can select different time periods to show how your metrics have changed over time.

FAQs
Click a question to learn more about analytics in the Wix Studio enterprise solution.
Why do I see discrepancies in data between the enterprise dashboard and site-level analytics?
Why do I see discrepancies in sales between the enterprise dashboard and site-level analytics?
What data can I see if my sites don't have sales data?

What happens to a site's metrics if I remove it from my Wix Studio enterprise account?