

Wix Analytics: About Your Subscriptions Analytics
4 min
In this article
- Key metrics
- Active subscriptions
- Revenue over the last 12 months
- Customer retention and customer value
- Retention over time
- FAQs
Subscriptions Analytics gathers all the key metrics for subscription-based businesses in one place. Track and analyze the performance of any pricing plans, recurring subscriptions, or product subscriptions that you offer.
You can find your Subscriptions Analytics in the Analytics section under Sales in your site's dashboard.

Key metrics
View the top subscription statistics during a selected time period. The default time period is set to the current month. Click the This month drop-down or All plans drop-down to filter by a different time period or specific plan.
The metrics in this section include:
- Total revenue: All the revenue coming from subscriptions only (not including Wix stores or other business apps).
- New subscriptions: All subscriptions purchased during the selected time period.
- Ended subscriptions: The number of subscriptions that expired, were canceled, or ended during the selected time period.
Note:
The data in the Subscriptions Analytics page relates to subscription activity only (including the revenue).

Active subscriptions
The Active subscriptions section shows the number of subscriptions that are active right now on the site. These include free and paid subscriptions. You can also view a breakdown of how many subscriptions are active per plan.

Revenue over the last 12 months
The Revenue over the last 12 months section displays a graph of the total revenue you've received from different types of subscriptions on your site over the last 12 months. View revenue for all plans together or click the All plans drop-down to filter by a specific plan.
The 4 revenue types include:
- One-time: Revenue from subscriptions that aren’t recurring (the client pays only once).
- First recurring: Revenue from the first payment of a recurring subscription.
- Recurring: Revenue from recurring payments (excluding first payment).
- Expected recurring: This metric calculates all the payments that you should get from existing subscriptions this month, but have not yet received.
Important: This isn’t a prediction based on historical sales, rather a projection of upcoming payments for existing subscriptions. This metric does not include new subscriptions that may be purchased in the future (during this month), and does not consider any possible cancellations.

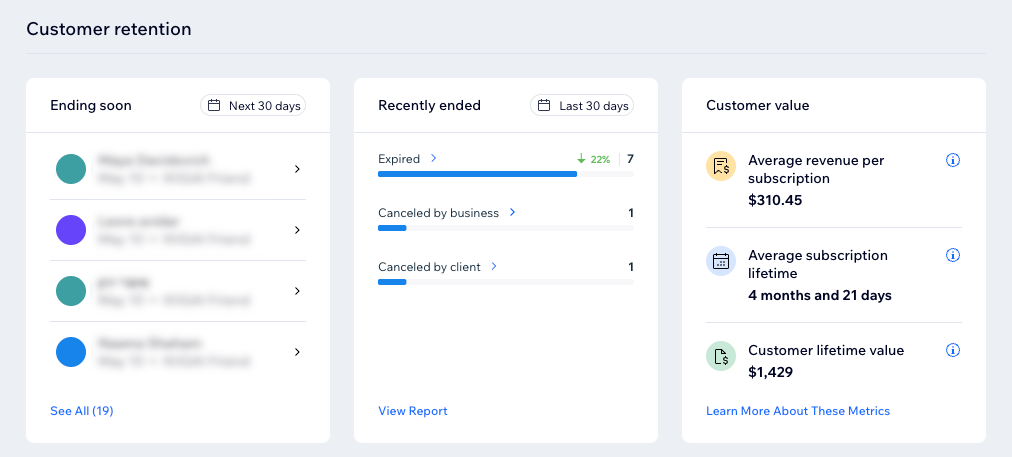
Customer retention and customer value
These sections help you understand how you retain subscribing customers over time as well as the value of the customer.
Customer retention shows you how many subscriptions are ending soon (next 30 days) as well as any recently ended subscriptions and the reason (payment failed, canceled by client, etc).
Customer value calculates different metrics about your subscription customers to help you plan and make informed decisions. The three main metrics used in this calculation are:
Average revenue per subscription (ARPS)
Average subscription lifetime
Customer lifetime value
Retention over time
The Retention over time chart displays how different groups of subscribers who subscribed in the same month kept subscribing over the following 12 months.
This chart is helpful to understand long-term customer behavior, effectiveness of marketing campaigns, and can help predict churn. Filter by percentage or number at the right. You can also hover over a month to see more details.
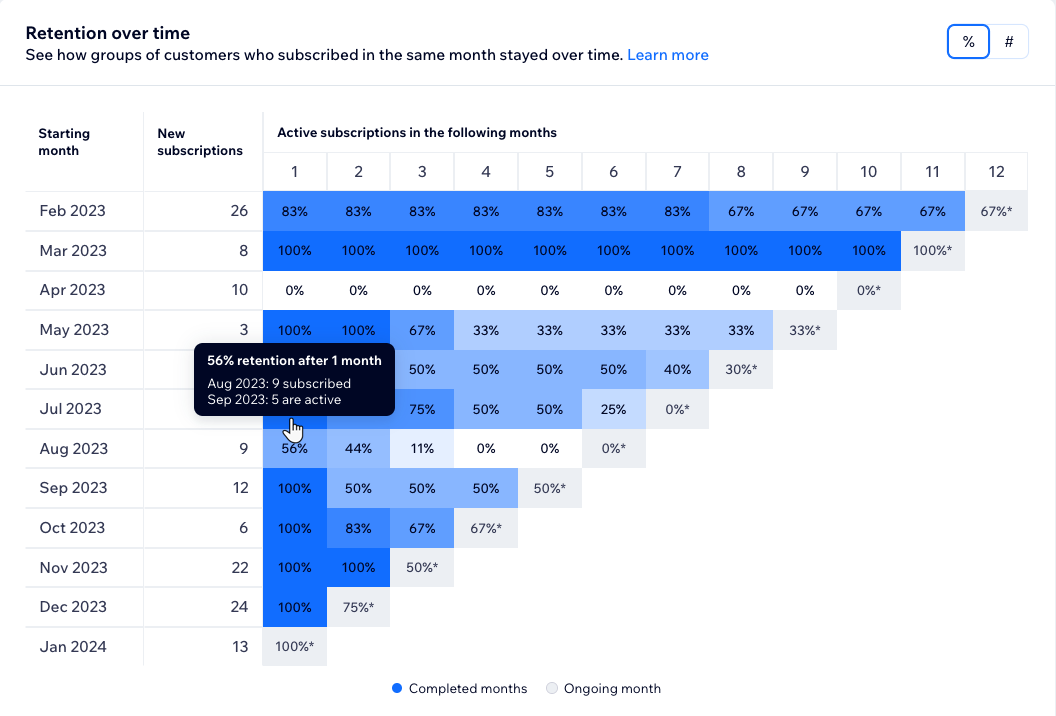
The vertical 'y' column shows the starting month, and the horizontal 'x' column shows each following month and how many of subscribers who started in the first month stayed subscribed for months after.
For example, if you got 60 new subscribers in September 2023 and want to see how many stayed on until the end of the year, hover over the '3' column in the September 2023 row to see how many of those subscribers were still active in December (3 months later).
FAQs
Click a question below to learn more about Subscriptions Analytics.
What type of subscriptions are tracked?
How do I change the timeframe of the data shown?
Does the revenue metric include earnings from other Wix business apps?