Wix Stores: About Your Store Analytics
7 min
In this article
- Key stats
- Products
- Conversion funnel
- Abandoned carts funnel
- FAQs
Get a comprehensive view of your online store's performance with Store Analytics. By analyzing key stats, product sales and conversions, you gain valuable insights into your store's sales trends and customer behavior.
Use this data to make informed business decisions. For example, if you notice that a particular product has many views but few sales, you could adjust its pricing or improve its product description to boost conversions.
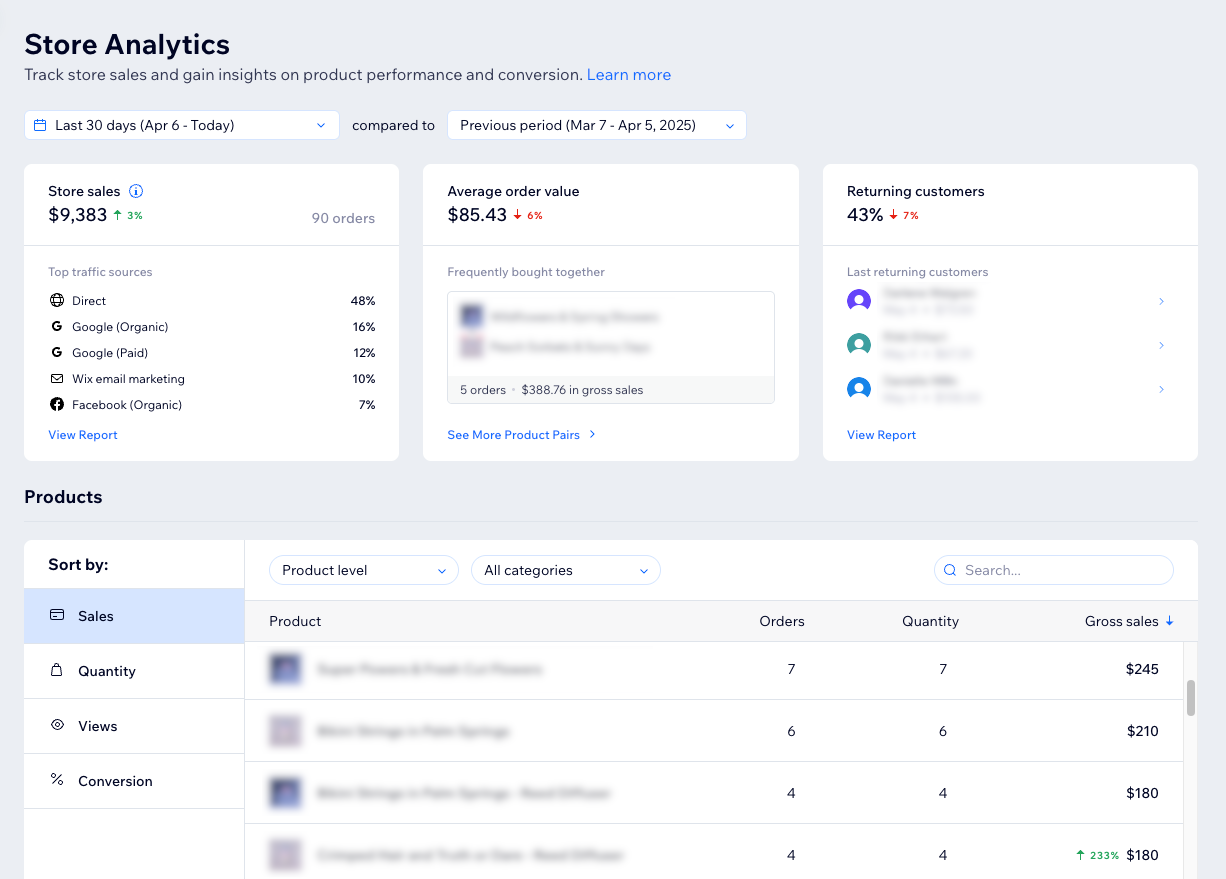
You can find your Store Analytics in the Analytics section under Sales in your site's dashboard.
Tips:
- Click the date picker drop-down at the top to change the time period that data is pulled from (the default is the last 30 days). Then use the next drop-down to compare it to the previous year or the previous time period (e.g. the previous 30 days).

- Click View Report in a section to see an in-depth report about that activity.
Key stats
The first section of the Store Analytics page provides stats on your sales, the average order value, and your returning customers. Monitoring these key stats enables you to quickly see how your sales are doing and spot any trends.
Store sales
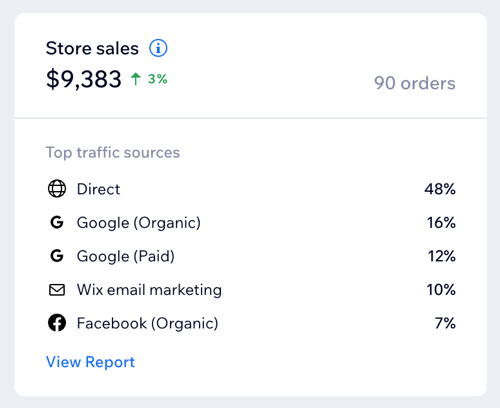
Store sales show the sales made from Wix Stores. This is the expected amount before deducting any refunds, shipping, and fees that customers will pay or have already paid. If an order isn't cancelled and not paid yet, the amount gets added to store sales.
In this section, you can see the total amount of sales and the number of orders placed. Below this, the top traffic sources show the sites that customers visited before landing on your store page.
Note:
Store sales only include sales from Wix Stores, but you may have more sales from Bookings, Subscriptions, and other sources. Check out the Sales Overview to see all your site's sales.
Average order value
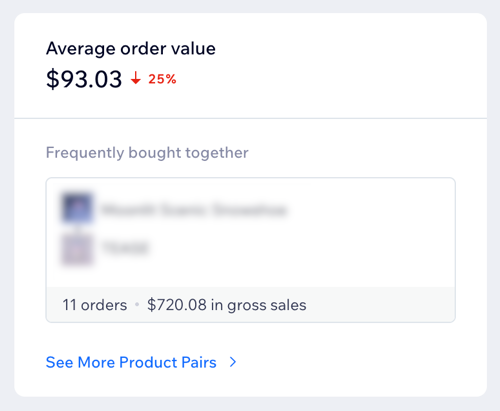
Your average order value is the calculation of store sales divided by the number of orders. You can also see here which products are frequently bought together, how many orders were placed with this combination, and how much it made in gross sales.
Tip:
Click See More Product Pairs for more popular products that are frequently bought together.
Returning customers
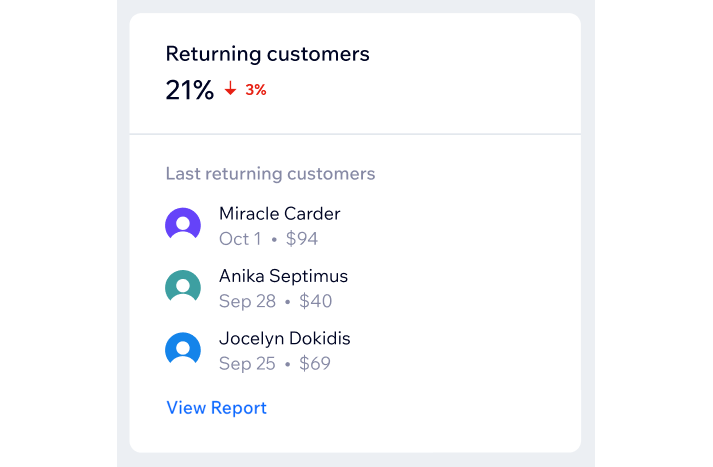
Returning customers show the customers who made a purchase in this period and have made a purchase before. Here you can see your last returning customers, sorted by the last order date, and the amount that the customer spent on this visit.
Products
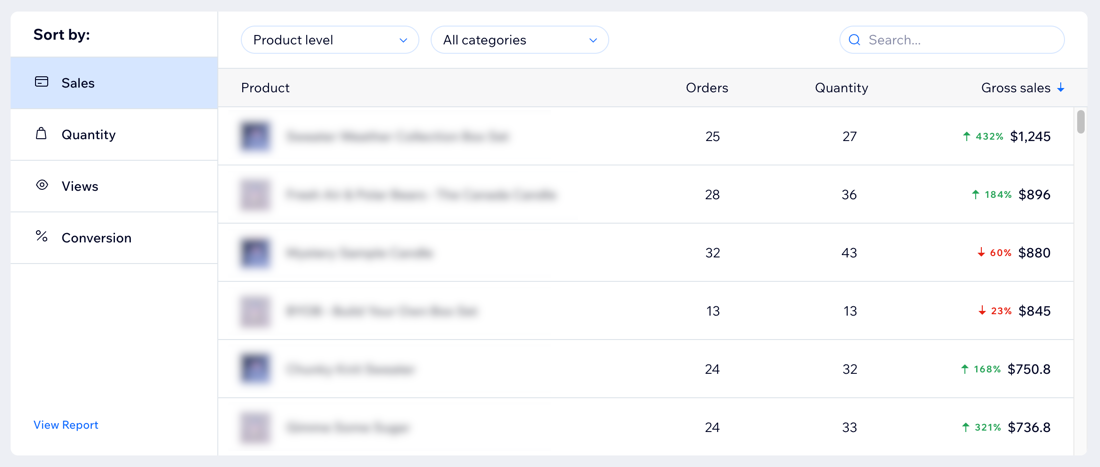
This section helps you analyze product performance by providing data per product on the number of orders, sales, net revenue, and more. For example, you can see which is your top-selling product or which product gets the most views on your site.
Select a metric under Sort by:
- Sales: Sort by top-selling products in gross sales.
- Quantity: Sort by the number of sold items.
- Views: Sort by the number of views of the product's page.
- Conversion: Sort by the percentage of sessions that ended with a purchase, out of all sessions where the product was viewed.
Click the Product level drop-down to choose between showing data by products (e.g. T-shirts) or by variants (e.g. black T-shirt in size M). You can also filter by product category using the All categories drop-down (e.g. show only T-shirts). Learn more about creating product options.
Tip:
By default, the products are sorted from the highest to lowest value of the chosen metric. Click the header with the arrow to change the sorting.


Conversion funnel
The conversion funnel shows how many site sessions resulted in purchases. Understanding the gap between the number of site visitors and the number of purchases can help you get a clearer view of your site's effectiveness.
Choose to see the conversion rates on desktop, mobile, or all at the top of the section.
You can compare the overall conversion rate and every step of the funnel to similar sites in your category and location. A thumbs up icon  means you're doing better than other sites and a repair tool icon
  means this step of the funnel can be improved.
 means you're doing better than other sites and a repair tool icon
  means this step of the funnel can be improved.
The steps of the funnel include:
- Site sessions: A site session is a visit to your site. It ends after 30 minutes of inactivity.
- Viewed product: The product view rate is the percentage of sessions where a product was viewed, out of all site sessions.
- Added to cart: The add to cart rate is the percentage of sessions where a product was added to the cart, out of all sessions where a product was viewed.
- Reached checkout: The cart to checkout rate is the percentage of sessions that reached checkout, out of all sessions where a product was added to the cart.
- Converted sessions: The session conversion rate is the percentage of converted sessions out of all site sessions. This rate shows how many of your site sessions result in a purchase.
Note: These purchases include Wix Stores products only. Purchases from other apps (e.g., booking a session through Wix Bookings) will not be counted as a converted session in this step.
Tip:
You can update your site's category and location to make sure you're getting compared to the most relevant sites. To do this, hover over sites like yours and click Change. Update the data in the Site category and Location drop-downs, and then click Done.

Abandoned carts funnel
The abandoned carts funnel shows how many carts get to each stage and their total value. Use this information to identify potential obstacles in your checkout process and see where you stand compared to similar sites.
The steps of the funnel include:
- All carts: The total number of carts that were created.
- Abandoned carts: Carts that did not go through checkout.
- Can be recovered: Abandoned carts that can be recovered by contacting the customer.
- Recovered carts: Abandoned carts that were eventually purchased (i.e. the customer returned to complete the purchase of products in the cart).
Note: You won't see this step if you don't have an active abandoned cart email automation.

Boost sales by recovering abandoned carts:
Set up an automated email to remind customers of their abandoned carts. This sends them a personalized email displaying the items they left in their cart with a link to complete their purchase.
FAQs
Click a question to learn more about Store Analytics.
What do the terms used in this overview mean?
What do the percentages indicate?
Why are there no products showing as frequently bought together in the average order value section?
Why can't I see all my products in the Products table?
Can I see data about my store inventory in this overview?


