Wix Bookings: About Your Bookings Analytics
9 min
In this article
- Choosing your view
- Spots filled / Appointments
- Predicted occupancy / Predicted appointments
- Top class sessions
- Popular times & Popular services
- Bookings & Booking sales
- Clients
- Staff performance
- FAQs
Analyze your bookings performance and gain insights to optimize your business in one place with Bookings Analytics. Track the performance of your classes or appointments, see which services are most popular, and monitor staff and client stats.
Whether you run a gym offering classes or a hair salon with individual appointments, see the stats that matter to you and adjust your schedule or class offerings accordingly. This data helps you make informed decisions to better meet client demand and improve your business operations.
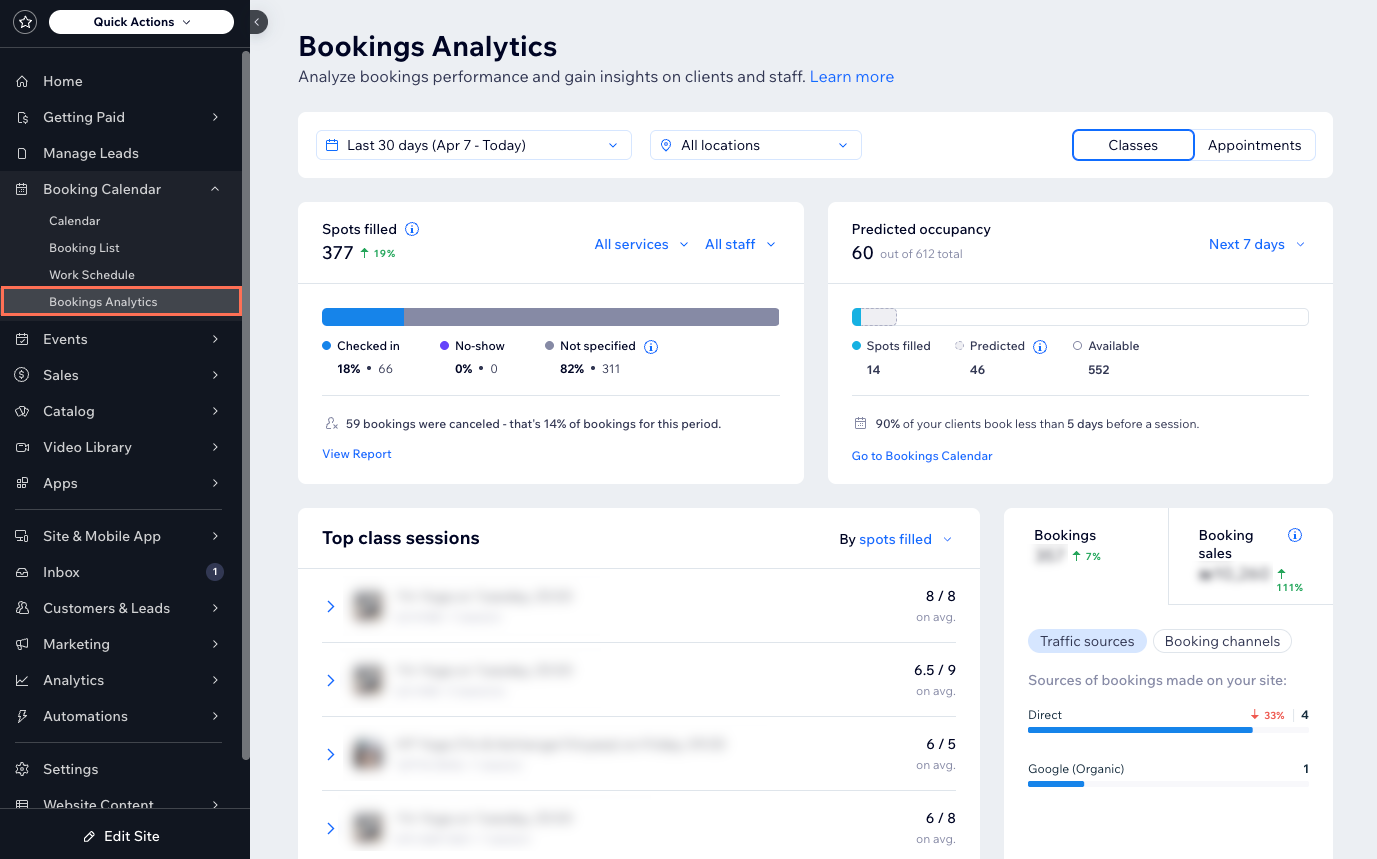
You can find your Bookings Analytics under Booking Calendar in your site's dashboard.
Choosing your view
To get started, choose a view at the top right according to your service type: Classes or Appointments. Each view changes the metrics accordingly. For example, the Classes view shows your top classes while the Appointments view shows your most popular times and services.
Once you've chosen your view, display the data range you need:
- Choose a time period: Click the date picker drop-down at the top to change the time period the data is pulled from (the default is the last 30 days).
- Choose a location: If you have multiple locations, click the All locations drop-down at the top right to select which locations to display (the default is all locations).

Tip:
Click View Report in a section to view an in-depth report about that Bookings activity.
Spots filled / Appointments
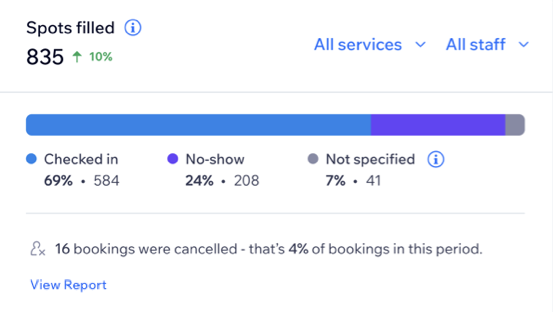
What you see in this section depends on your chosen view. The Classes view shows you the number of spots that were booked in sessions that occurred in this time period. The Appointments view shows the number of appointments booked to occur in this time period.
Use the All services and All staff drop-downs to select specific services and staff members. This data can help you evaluate services and staff performance, and make data-driven decisions.
The progress bar shows you the distribution of spots by attendance status:
- Checked in: Clients who arrived to the session.
- No-show: Clients who booked the session but didn't end up coming.
- Not specified: Clients who aren't marked as checked in or no-show.
Below the progress bar you can see the percentage of cancelled bookings. This is the number of cancelled spots out of the total bookings for sessions that took place in the specified time period.
Note:
For clients to be marked as checked in or a no-show, you must update the attendance status after each session. This will give you the most accurate attendance breakdown.
Predicted occupancy / Predicted appointments
Understand and anticipate client demand by checking the upcoming week's predicted occupancy or appointments, so you can be best prepared for what's to come.
What you see in this section depends on your chosen view. The Classes view shows you the predicted occupancy while the Appointments view shows you the predicted appointments.
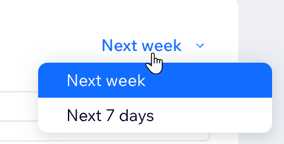
Click the drop-down to show the predicted occupancy or predicted appointments for the next week (7 days starting next Sunday) or the next 7 days (7 days starting tomorrow).
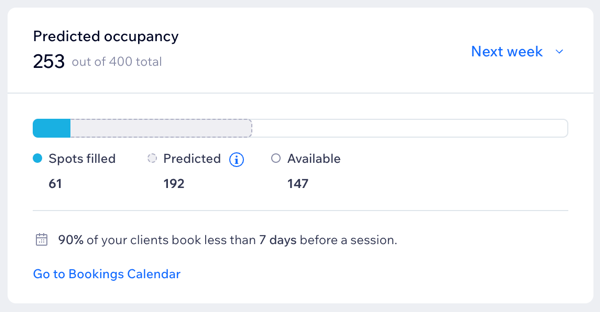
The progress bar shows you the following details:
- Spots filled/Confirmed appointments: This is the number of already booked sessions.
- Predicted: This is the number of additional bookings that are likely to be made based on the confirmed bookings from the previous 3-4 weeks.
- Available: In the Classes view, this is the number of spots left open. It's calculated as the total capacity minus predicted occupancy.
Note:
Predicted occupancy or appointments is the sum of confirmed spots that you already have for the next week/next 7 days and the predicted spots. The predicted numbers rely on the number of confirmed bookings in the past 3-4 weeks.
Top class sessions
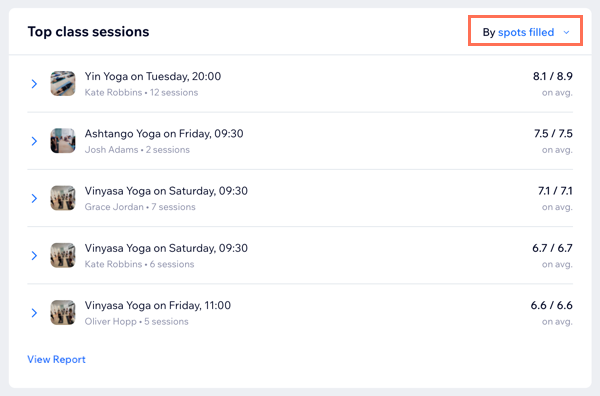
This section shows your site's top services at a specific day and time, and with which staff member. This is useful for making decisions based on a class's popularity. If a class is highly requested, you may decide to add more sessions for that class type or open up more spots.
Note:
This section is only available in the Classes view.
Click the drop-down to change the metric:
- By spots filled: The average number of booked spots, taken from all class sessions held during the selected time period.
- By occupancy: The number of booked spots out of the maximum spots available.
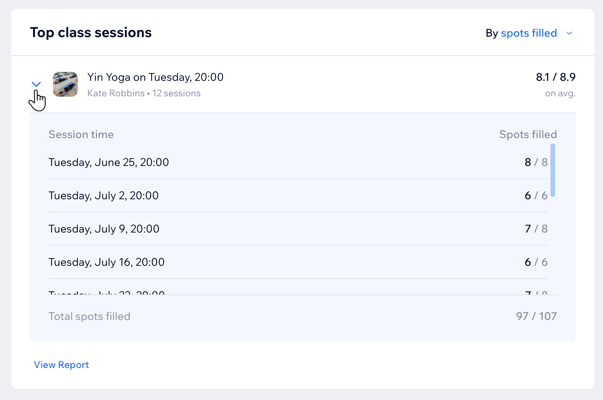
Click a class to expand it and see the number of total spots filled or occupancy for each session time.
Popular times & Popular services
This section shows you what your popular services and times are. This can help you determine if to increase staff or add more services, based on performance. Switch between the Popular times and Popular services tabs to see different data.
Note:
This section is only available in the Appointments view.
Popular times
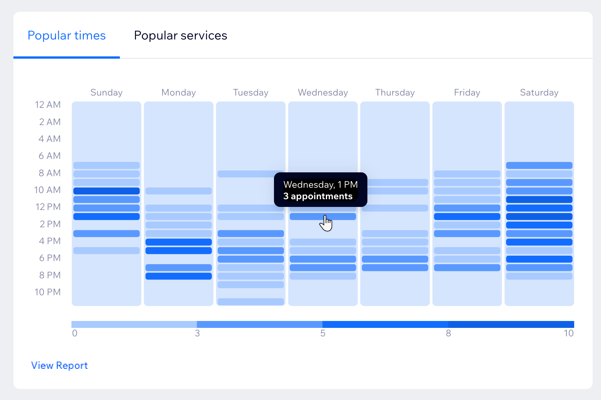
The heatmap allows you to easily identify the peak times of your business by the number of clients present during each hour. The darker the time slot, the more appointments booked for that time. Hover over a time slot to see the exact number of appointments held at that time.
Note:
The heatmap considers both the start times of sessions and their duration. For example, if a client starts an appointment at 12 pm and it lasts for 2 hours, they are counted as present for the 12 pm and 1pm timeslots.
Popular services
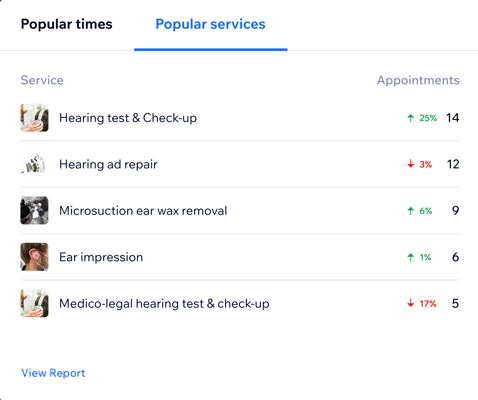
See your most popular services and the number of appointments booked per service type. The percentages next to the appointments indicate an increase (green) or decrease (red) in the number of appointments booked, compared to the previous time period.
Bookings & Booking sales
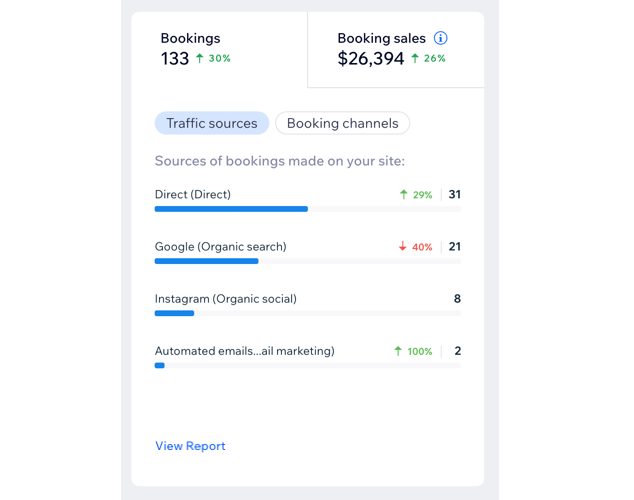
See here the total bookings and sales made through Wix Bookings in the selected time period, and where they were made from. The percentages indicate an increase (green) or decrease (red) in the number of bookings or booking sales, compared to the previous time period.
Bookings
The Bookings tab shows the number of bookings that were made in the selected time period and where the booking came from. Choose an option to view insights:
- Traffic sources: For bookings that were made through the site, see where these visitors came from. These include referring sites, such as Facebook or Google. This only includes bookings made by clients following a visit to your site.
- Booking channels: These are platforms used by clients for booking. They include external apps (e.g., ClassPass), manual orders, Wix apps, and web.
Booking sales
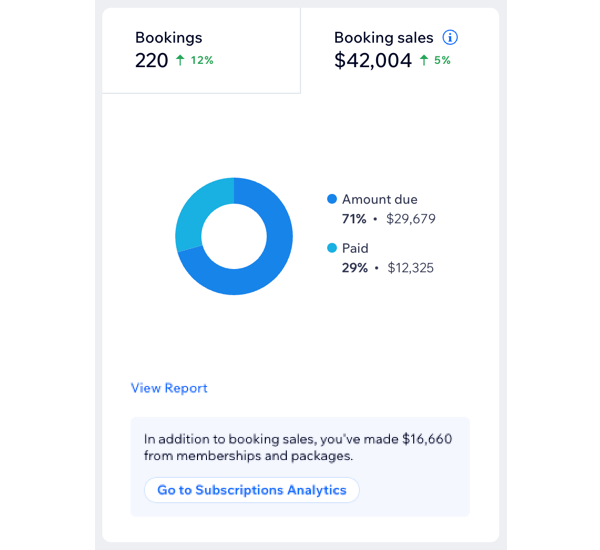
The Booking sales tab shows the total sales made from bookings. The pie graph breaks down the payment status:
- Amount due: Sales from sessions that have been booked but not yet paid for.
- Paid: Sessions booked and paid for.
Selling memberships and packages too?
See how much you've made separately from memberships and packages at the bottom of the Booking sales tab. Head over to your Subscriptions Analytics to get more insights on how your pricing plans and subscriptions are performing.
Clients
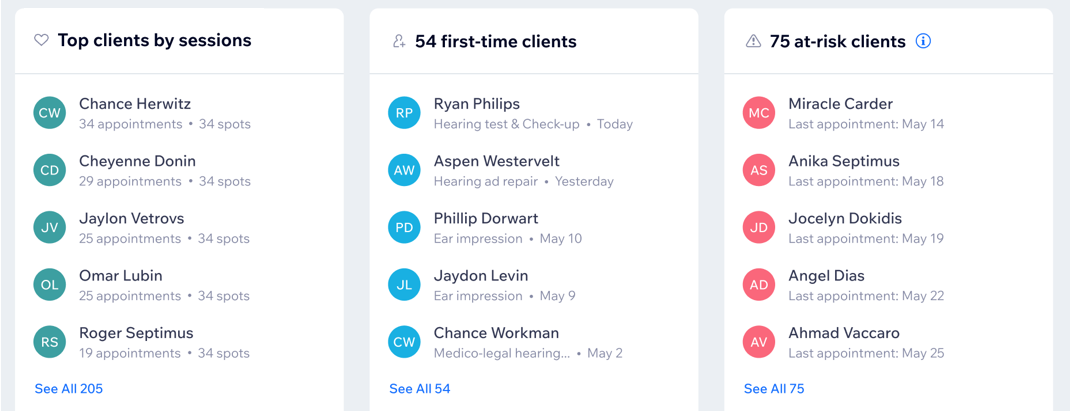
The Clients section provides lists of clients in different statuses, so you can take actions to maximize retention and strengthen your communication channels.
Clients are sorted into the following categories:
- Top clients by sessions: These are clients who participated the most in sessions in the selected time period, sorted by the number of sessions they booked.
- First-time clients: These are clients who attended their first session during the selected time period.
- At-risk clients: These are clients who have become less active in the last 90 days and are at risk of not returning to the business.
Notes:- This list is only available if you have returning clients. This is determined by having 20% of your clients that booked in the last 6 months to have booked more than once.
- If you don't have at-risk clients, you will see the number of returning clients to your business in the selected time period instead. These are clients that have already visited your business in the past.
Tip:
Click a client name to open their contact card where you can see their bookings, purchase stats, and directly communicate with them.
Staff performance
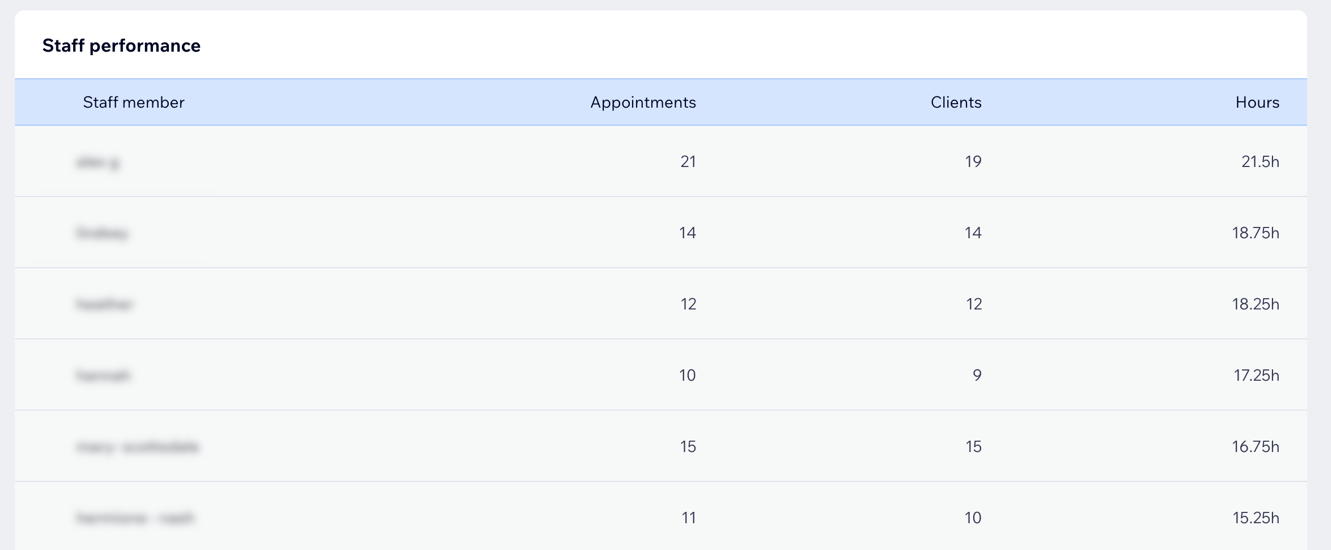
See how your staff members are performing in this section. You can see how many appointments or sessions they've held, how many clients they've had, and the total hours worked. Click on a staff member to see a breakdown of their services and sessions.
Notes:
- By default, the staff list is sorted by hours.
- This table is not available if you only have one staff member listed.
FAQs
Click a question below to learn more about Bookings Analytics.
How do I know which view is for me?
Is there a view available for Courses?
What's the difference between bookings and spots filled?
How are at-risk clients determined?


