
Velo: Connecting Wix Logs to a Monitoring Tool (Advanced)
2 min
In this article
- Overview
- Wix Logs Lifecycle
- Step 1: Build Your HTTP Endpoint
- Step 2: Set Your Endpoint
Visit the Velo by Wix website to onboard and continue learning.
The Velo logs feature allows you to connect Wix Logs to an external monitoring tool. This article explains how to connect your Wix Logs to a monitoring tool of your choice.
Notes
- To use logs, you must enable Velo Dev Mode for your site.
- To learn about viewing logs in real-time without connecting to an external tool, click here.
- To learn about easily connecting to the Google Cloud Logs, click here.
Overview
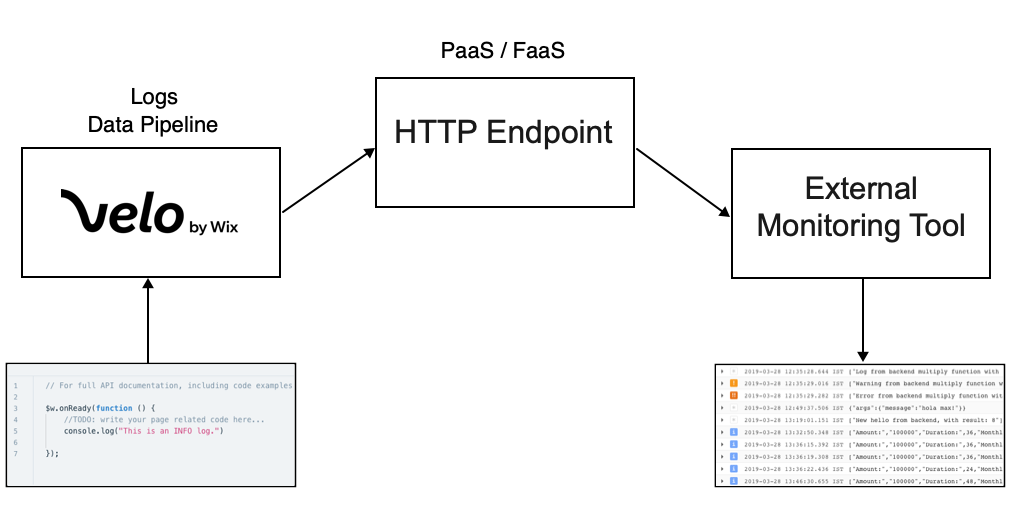
To connect your monitoring tool, you need to provide Velo with an HTTP endpoint URL. Once the HTTP endpoint is set, Velo sends logs in the form of JSON objects to the endpoint. The endpoint must include code for adapting the JSON objects so that your external monitoring tool can parse them.
Wix Logs Lifecycle
To understand your part in the connection process, it's helpful to first learn the general lifecycle of Wix Logs that are connected to an external monitoring tool:
- Wix Logs records implicit and explicit logs in JSON format.
- Velo sends the JSON objects to your HTTP endpoint.
- Adapter code converts the JSON objects into a format that can be parsed by your external monitoring tool of choice.
- The adapted JSON objects are sent to your monitoring tool for analysis.
Step 1: Build Your HTTP Endpoint
Notes:
- You cannot build your HTTP endpoint on the Wix site you want to monitor.
- When you create your endpoint, use the POST method.
To build your endpoint, you first need a thorough understanding of the JSON representation of Wix Logs. Each log is recorded as a single log entry in JSON format. You can see a detailed description of log entries here.
Next you need to create adapter code to convert the JSON objects into a format that can be parsed by your external monitoring tool. You also need code that sends the JSON objects to the tool.
For your convenience, we created 2 open-source examples of adapter code that you can revise to build your own HTTP endpoint:
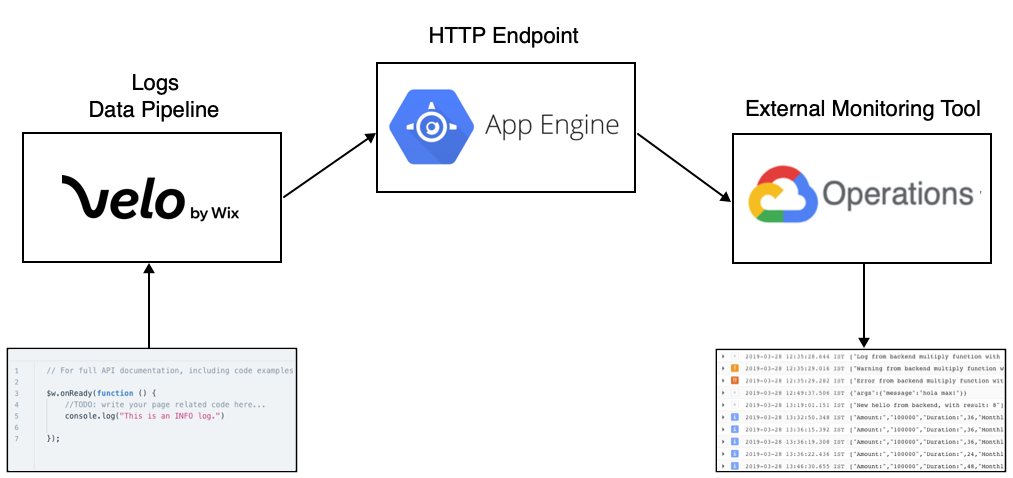
- Example 1:
- Monitoring Tool: Google Cloud Logs
- Platform: Google App Engine
- View example
- Example 2:
- Monitoring Tool: Solarwinds Loggly
- Platform: Google App Engine
- View example
The code is specific to the examples, but you can adapt it for your tool of choice.
Step 2: Set Your Endpoint
Once you've built your HTTP endpoint, you can connect Wix Logs to your monitoring tool by setting the endpoint in your site:
- In your site's dashboard, select Developer Tools.
- Select Logging tools.
- In Connect an external logging tool, click Next>.
- In Enter your endpoint URL, enter your endpoint URL and click Connect.
Once your endpoint is connected, Velo starts sending logs to your monitoring tool.