

Viewing and Customizing Analytics Overviews in Wix Dashboard
3 min
In this article
- Reading Analytics Overview Cards
- Customizing Your Analytics Overview
The Analytics Overview cards in your dashboard display a snapshot of your sessions, visitors, and active leads data. You can customize your dashboard to display information about your site performance that you find the most helpful.
Learn how to:
Reading Analytics Overview Cards
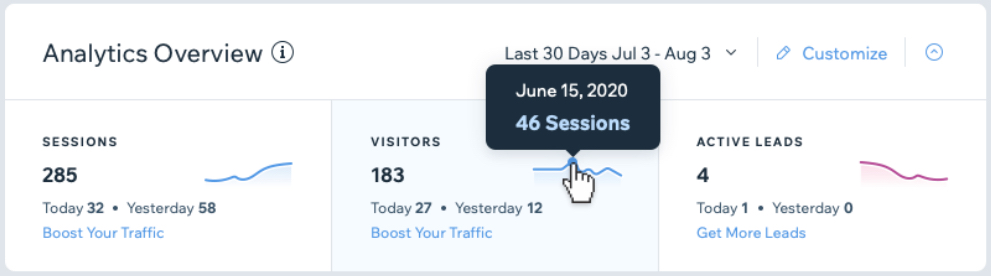
In each overview, you'll see stats for today and yesterday, and a line graph showing the trend of sessions, visitors, and active leads over the last 30 days. Hover over the length of the line graph and you'll see data for each date within that period.
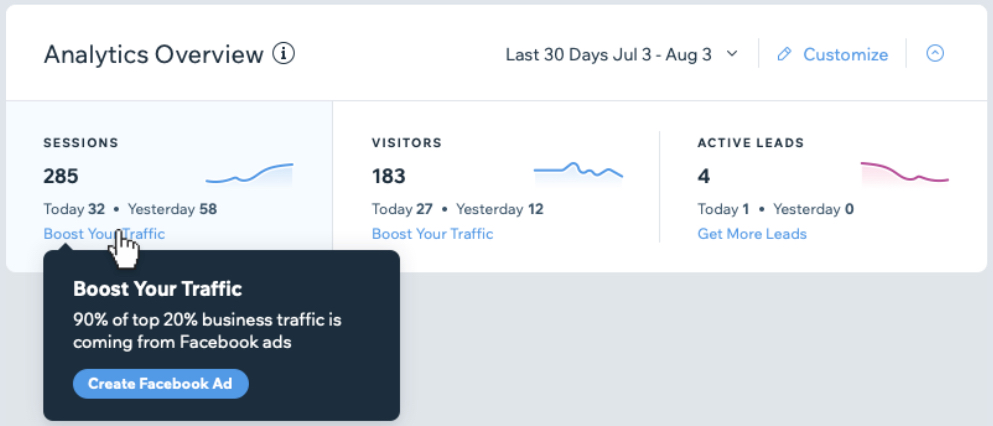
Actions Items Based on Your Data
Each overview card contains a related action item to help improve your site, increase traffic, and generate sales of your products and services.
Want to learn more about your data?
Click on an Overview card in the dashboard to view the full Analytics Report.
Customizing Your Analytics Overview
You can add and remove stats in your dashboard to monitor the data you're most interested in, and arrange how the Analytics Overview cards are displayed.
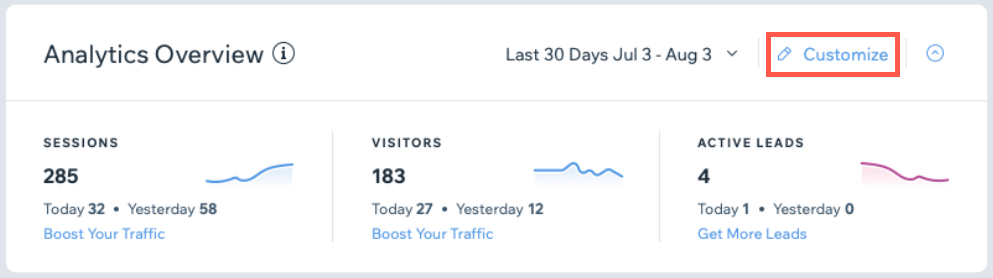
To customize your Analytics Overview:
- Go to your Wix site dashboard.
- In the Analytics Overview card, click Customize.
- Choose an action below:
Add more Analytics cards

Remove an Analytics card

Arrange how you want your Analytics cards displayed