Wix Marketplace: About Your Marketplace Overview Tab
4 min read
Keep track of your performance and project activity as a Wix Partner with the Marketplace Overview tab. Set your availability to receive project requests and leads, track lead conversions, and review your project completion stats by category or service. Gain valuable insights into your performance and identify trends to improve your business in the Wix Marketplace.
In this article, learn more about:
Setting your availability for receiving projects
As a Partner in the Wix Marketplace, it's important to set your availability to avoid receiving project requests or leads when you're unavailable. Failure to respond to requests within 3 days may affect your ranking in the Wix Marketplace. So make sure to adjust your availability before going on vacation or taking a break.
To set your availability:
- Log in to your Wix account and click Partner Dashboard at the top.
- Click the Wix Marketplace tab on the left.
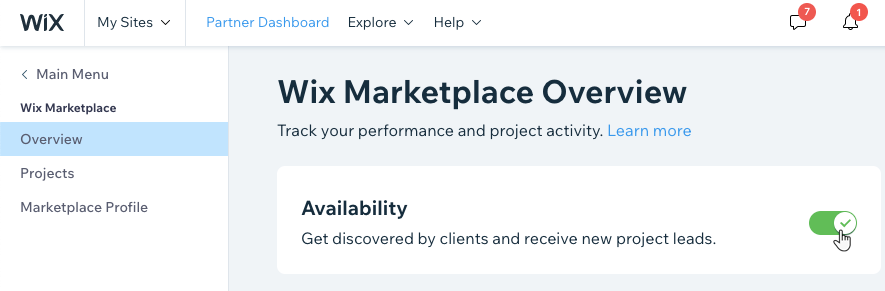
- Click the Availability toggle
 to enable or disable it:
- Enabled: Clients can find your profile in the Wix Marketplace to send you project requests, and Wix can send you leads.
- Disabled: Your profile is hidden from the Wix Marketplace, and you cannot receive project requests from clients or leads from Wix.
Note:
Make sure to respond to all leads within 3 days so you can continue receiving project requests from the Wix Marketplace.
Reviewing your Performance funnel chart
See how well you've been converting leads to completed projects in your Performance funnel. The chart displays the percentage of leads converted through each status for your selected time period.

To review your Performance funnel chart:
- Log in to your Wix account and click Partner Dashboard at the top.
- Click the Wix Marketplace tab on the left.
- Click the drop-down next to Last 30 days and select the date range for viewing your performance stats.

- View the following Performance funnel stats for the selected time period:
- Total Leads: The total number of leads you've received.
- Contacted: The total leads you've responded with Yes, Send a Message.
- In discussion: The total leads that replied back after you contacted them.
- In progress: The total leads you've marked as In progress.
- Completed: The total projects you submitted.
Note: Projects count as "Completed" if you received and submitted them within the selected time range. For example, if you submitted a project that you received more than 30 days ago, and you select Last 30 days, the project does not count as completed for the selected time range.
Tip:
Learn more about managing your projects.
Reviewing your Project completion rate table
When clients submit project requests, they select the service or category they need help with. Your Project completion rate table displays stats for your leads, broken down by category/service. For each category/service, view your total leads, completed projects, rate of completion and average time to complete.
To review your Project Completion Rate table:
- Log in to your Wix account and click Partner Dashboard at the top.
- Click the Wix Marketplace tab on the left.
- Click the drop-down next to Last 60 days and select the date range for viewing your Project completion rate stats.

- View the following Project completion rate stats for the selected time period:
- Category / Service: The category or service based on the client's submitted project request.
- Leads: The total leads or project requests you received directly from clients or the Wix Marketplace.
- Completed: The total of projects you submitted.
Note: Projects count as "Completed" if you received and submitted them within the selected time range. For example, if you submitted a project that you received more than 30 days ago, and you select Last 30 days, the project does not count as completed for the selected time range. - Rate: The total projects you completed out of all the requests you've received.
Tip:
Click the heading of the relevant stat to sort the table. You can also click on a category / service to expand it for more detailed stats.

Did this help?
|